What is Alertmanager and Its Use Cases?
Efficient monitoring and alerting are essential for maintaining the reliability of IT systems and applications. Alertmanager, an integral component of the Prometheus ecosystem, is a powerful alert management tool designed to handle alerts from monitoring systems and route them to the appropriate channels for resolution. By centralizing alert handling, Alertmanager ensures that critical issues are addressed promptly and systematically.
From deduplication and silencing to routing alerts to multiple receivers, Alertmanager plays a vital role in improving operational efficiency and reducing noise in monitoring workflows.
What is Alertmanager?
Alertmanager is an open-source alert management tool developed by the Prometheus project. It is designed to handle alerts generated by Prometheus or other monitoring systems, enabling teams to manage and respond to incidents efficiently. Alertmanager supports features like deduplication, grouping, silencing, and routing, ensuring that alerts are organized and actionable.
By integrating with various notification systems, including email, Slack, PagerDuty, and more, Alertmanager facilitates seamless communication between monitoring systems and IT or DevOps teams.
Top 10 Use Cases of Alertmanager
- Centralized Alert Management
Aggregate alerts from multiple Prometheus servers and other monitoring tools into a single interface. - Deduplication of Alerts
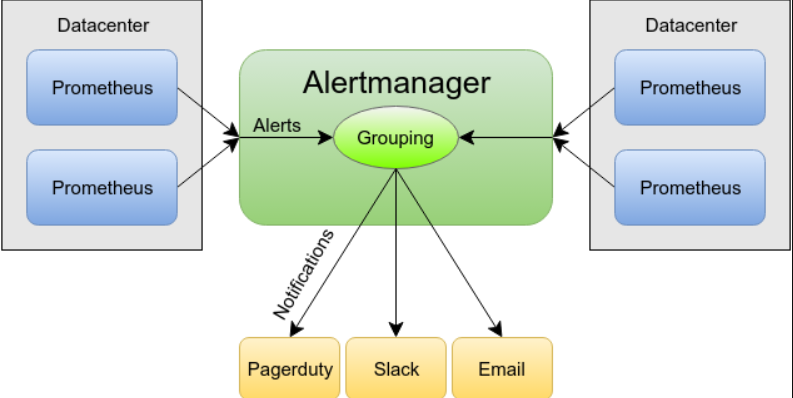
Combine multiple alerts for the same issue into a single notification, reducing alert fatigue. - Alert Grouping
Group related alerts together based on predefined labels, making them easier to understand and manage. - Routing Alerts to Specific Teams
Define routing rules to send alerts to the appropriate teams or individuals based on severity, service, or environment. - Silencing Alerts
Temporarily suppress alerts for planned maintenance or known issues to avoid unnecessary notifications. - Escalation Policies
Define escalation rules to ensure critical alerts are addressed promptly if the initial recipient doesn’t respond. - Integration with Notification Systems
Send alerts to multiple platforms, such as email, Slack, PagerDuty, OpsGenie, or SMS. - Multi-Tenant Support
Manage alerts for multiple environments or teams in a single instance, ensuring efficient resource usage. - Alert Visualization
Use integrations with tools like Grafana to display and analyze alerts in real time. - Proactive Incident Management
Enable proactive resolution of issues by configuring alerts for anomalies and threshold breaches.
What Are the Features of Alertmanager?

- Alert Deduplication
Automatically identify and group duplicate alerts to reduce notification noise. - Alert Grouping
Combine related alerts into a single notification for better context and clarity. - Routing Rules
Define flexible routing rules to send alerts to the right channels or teams. - Silencing and Inhibition
Suppress alerts during maintenance windows or when related alerts have already been acknowledged. - Multi-Receiver Support
Send alerts to multiple notification systems simultaneously. - Customizable Templates
Use templates to format alert messages according to organizational requirements. - Integration with Prometheus
Seamlessly integrates with Prometheus for a complete monitoring and alerting solution. - Scalability
Handle large volumes of alerts efficiently, making it suitable for enterprise environments. - Webhook Support
Trigger custom actions or integrate with third-party systems via webhooks. - High Availability
Deploy Alertmanager in a highly available configuration to ensure reliability.
How Alertmanager Works and Architecture
How It Works:
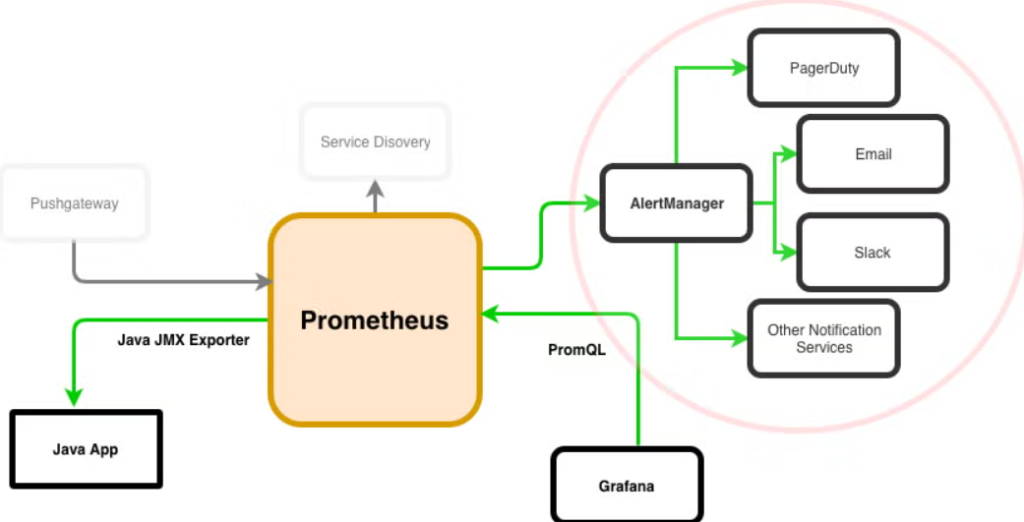
Alertmanager processes alerts sent by Prometheus or other monitoring systems. These alerts are grouped, deduplicated, and routed based on predefined rules. Notifications are then sent to the appropriate channels or systems for action.
Architecture Overview:
- Alert Sources:
Monitoring tools like Prometheus send alerts to Alertmanager. - Alertmanager Configuration:
Define rules for grouping, deduplication, routing, and silencing. - Notification Channels:
Alerts are sent to configured notification systems, such as Slack, PagerDuty, or email. - Integration with Dashboards:
Visualize and manage alerts through integrations with tools like Grafana. - High Availability (Optional):
Deploy multiple instances of Alertmanager in a cluster for fault tolerance.
How to Install Alertmanager
Steps to Install Alertmanager on Linux:
1. Download Alertmanager:
Visit the official Prometheus website and download the latest Alertmanager release.
wget https://github.com/prometheus/alertmanager/releases/download/v<version>/alertmanager-<version>.linux-amd64.tar.gz2. Extract the Package:
tar -xvf alertmanager-<version>.linux-amd64.tar.gz
cd alertmanager-<version>.linux-amd64
3. Run Alertmanager:
Start Alertmanager using the following command:
./alertmanager --config.file=alertmanager.yml4. Configure Alertmanager:
Edit the alertmanager.yml file to define routes, receivers, and other settings. For example:
global:
  resolve_timeout: 5m
route:
  group_by: ['alertname']
  receiver: 'email-alert'
receivers:
  - name: 'email-alert'
    email_configs:
      - to: 'team@example.com'
        from: 'alertmanager@example.com'
        smarthost: 'smtp.example.com:587'
5. Access the Web Interface:
Open your browser and navigate to http://<your_server_ip>:9093 to view the Alertmanager dashboard.
Basic Tutorials of Alertmanager: Getting Started
1. Configuring Notification Channels
Set up channels like email, Slack, or PagerDuty by adding their configurations to the alertmanager.yml file.
2. Grouping Alerts
Define labels to group similar alerts together for better context:
route:
  group_by: ['alertname', 'severity']
3. Silencing Alerts
Suppress specific alerts during maintenance or known issues through the web UI or API.
4. Testing Alerts
Use Prometheus to trigger a test alert and verify that Alertmanager processes and sends it correctly.
5. Integrating with Grafana
Connect Alertmanager to Grafana to display alerts in dashboards and enhance visibility.
6. High Availability Setup
Deploy multiple Alertmanager instances and configure them to work in a clustered mode for reliability.