As modern applications and systems become more complex, effective monitoring tools are essential to ensure performance, availability, and reliability. Microsoft Azure Monitor is a comprehensive cloud-based monitoring and analytics solution designed to provide full-stack observability for Azure and hybrid environments. It enables organizations to collect, analyze, and act on telemetry data from their applications, infrastructure, and network.
Azure Monitor is an integral part of the Microsoft Azure ecosystem, helping teams gain actionable insights, diagnose issues, and optimize performance across resources and services.
What is Microsoft Azure Monitor?
Microsoft Azure Monitor is a cloud-native monitoring platform that collects and analyzes telemetry data from applications, infrastructure, and networks. It provides real-time monitoring and advanced analytics to identify and resolve performance issues, improve resource utilization, and ensure service reliability.
Azure Monitor works seamlessly across Azure resources and integrates with third-party tools to provide comprehensive observability. Its rich features, including alerts, metrics, logs, and dashboards, make it a vital tool for DevOps, IT operations, and development teams.
Top 10 Use Cases of Microsoft Azure Monitor
- Application Performance Monitoring (APM)
Track application performance and identify bottlenecks using Application Insights. - Infrastructure Monitoring
Monitor virtual machines, containers, and databases for health and performance issues. - Proactive Alerting
Configure alerts to notify teams of issues before they impact users. - Log Analytics
Analyze and query log data to troubleshoot issues and gain actionable insights. - Dependency Mapping
Visualize application dependencies to understand interactions and detect anomalies. - Cost Optimization
Analyze resource utilization and identify opportunities for cost savings. - Network Monitoring
Monitor network performance, including latency and throughput, for Azure and hybrid environments. - Security Monitoring
Detect and respond to security incidents using data from Azure Security Center. - Custom Dashboards
Create tailored dashboards to visualize key performance indicators (KPIs) across resources. - Integration with DevOps Tools
Automate workflows and incident responses by integrating with Azure DevOps, GitHub, and other CI/CD tools.

What Are the Features of Microsoft Azure Monitor?
- Metrics and Logs Collection
Collect real-time metrics and logs from Azure resources, applications, and third-party services. - Application Insights
Gain deep insights into application performance and user behavior. - Log Analytics
Use Azure Log Analytics to query, analyze, and visualize log data. - Alerts and Notifications
Configure alerts for specific metrics, thresholds, or log events, and send notifications to teams. - Custom Dashboards
Build personalized dashboards to track and visualize metrics and logs. - Integration with Azure Services
Seamlessly integrates with Azure services like Security Center, DevOps, and Logic Apps. - Network Insights
Monitor and analyze network connectivity, performance, and security. - Autoscaling Recommendations
Get recommendations for scaling Azure resources based on performance and demand. - API and SDK Support
Leverage APIs and SDKs to integrate Azure Monitor with custom applications and workflows. - Machine Learning Insights
Use advanced analytics and AI/ML to predict and prevent potential issues.
How Microsoft Azure Monitor Works and Architecture
How It Works:
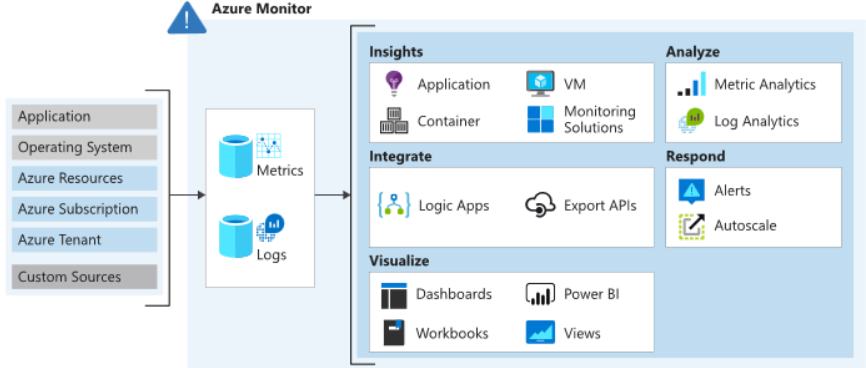
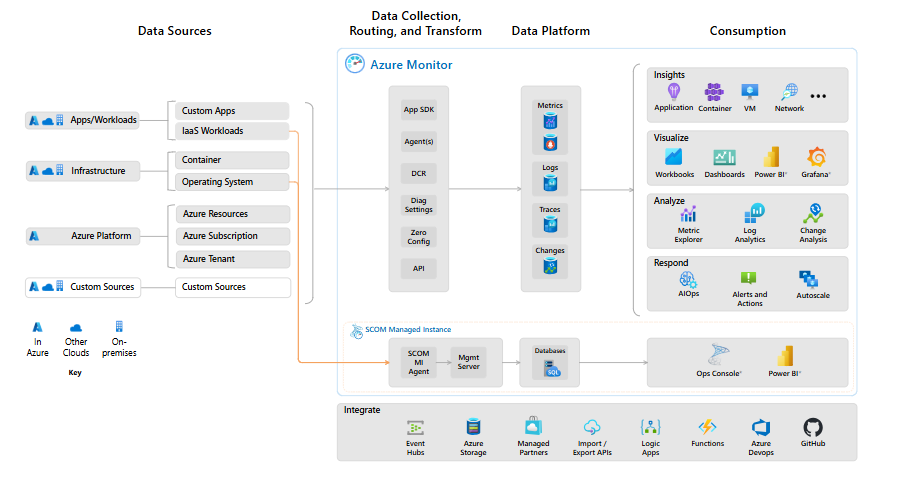
Azure Monitor collects telemetry data from Azure resources, applications, and on-premises environments. This data is stored and analyzed to provide insights, trigger alerts, and enable automation.
Architecture Overview:
- Data Sources:
Azure Monitor collects metrics, logs, and events from applications, Azure resources, and external systems. - Data Storage:
Telemetry data is stored in Azure Log Analytics, Application Insights, or Azure Storage for analysis. - Insights and Alerts:
Data is analyzed to generate insights, metrics, and alerts for actionable intelligence. - Visualization and Reporting:
Data is visualized using custom dashboards, Power BI, or third-party tools. - Integration and Automation:
Integrates with Azure services, DevOps tools, and automation workflows.
How to Install Microsoft Azure Monitor
Azure Monitor is natively integrated into the Azure platform, making it easy to set up and configure for Azure resources.
Steps to Set Up Azure Monitor:
- Access the Azure Portal:
Log in to the Azure Portal. - Enable Monitoring for a Resource:
- Navigate to the Azure resource (e.g., VM, App Service) you want to monitor.
- In the resource menu, select “Monitoring” and enable Azure Monitor.
- Configure Application Insights (For Applications):
- Navigate to Application Insights in the Azure Portal.
- Create a new Application Insights resource and connect it to your application.
- Add the Application Insights SDK to your application code for enhanced monitoring.
- Set Up Log Analytics Workspace:
- Create a Log Analytics Workspace in Azure Monitor.
- Connect Azure resources to the workspace to collect and analyze logs.
- Create Alerts:
- In Azure Monitor, go to “Alerts” and create alert rules for specific metrics or events.
- Define conditions, thresholds, and actions (e.g., send email, trigger automation).
- Customize Dashboards:
- Use Azure Monitor’s built-in tools to create custom dashboards for metrics and logs.
- Add widgets and charts to visualize performance indicators.
- Integrate with Third-Party Tools:
- Use Azure Monitor’s APIs or pre-built integrations to connect with tools like Splunk, Grafana, or PagerDuty.
- Test the Setup:
- Simulate a scenario (e.g., high CPU usage) to test alerts, metrics, and log collection.
Basic Tutorials of Microsoft Azure Monitor: Getting Started
- Creating a Log Query in Log Analytics
- Navigate to the Log Analytics workspace.
- Use KQL (Kusto Query Language) to write a query, such as:
AzureActivity | where ActivityStatus == "Failed"
- Setting Up Alerts for a VM
- Go to the VM resource.
- Select “Alerts” and create a rule for high CPU usage.
- Define thresholds, actions, and recipients for notifications.
- Connecting Application Insights to an App
- Enable Application Insights for an Azure App Service.
- Use the SDK to capture custom metrics and logs from the application.
- Building a Custom Dashboard
- Open the Azure Portal Dashboard section.
- Add widgets for metrics like CPU utilization, request rates, and response times.
- Using Network Insights
- Navigate to Network Insights in Azure Monitor.
- Analyze connectivity and performance data for Azure networks.