In today’s fast-paced IT environments, ensuring system uptime and performance is crucial for business continuity. Nagios is a powerful open-source monitoring system that helps IT teams monitor applications, networks, and infrastructure in real time. It is widely used to identify issues, ensure system reliability, and reduce downtime by offering actionable insights.
Nagios provides a centralized view of an organization’s IT environment, enabling proactive monitoring and efficient incident response. With its extensive plugin ecosystem and flexible architecture, Nagios is one of the most trusted tools for infrastructure monitoring.
What is Nagios?
Nagios is an open-source IT infrastructure monitoring tool that monitors systems, networks, applications, and services. It provides real-time alerts, performance data, and detailed reports to ensure that systems operate smoothly. Nagios helps administrators detect issues before they affect end-users, reducing the time required to troubleshoot and resolve problems.
Nagios supports a modular architecture, with Nagios Core as its central monitoring engine and plugins that extend its capabilities. It integrates with third-party tools and APIs, making it a versatile solution for diverse monitoring requirements.
Top 10 Use Cases of Nagios
- Server Monitoring
Monitor the performance and availability of Linux, Windows, and Unix servers, including CPU, memory, and disk usage. - Network Monitoring
Track the health of routers, switches, and other network devices to identify bottlenecks and failures. - Application Monitoring
Monitor critical applications like databases, web servers, and email systems for performance and uptime. - Log Monitoring
Collect and analyze system logs to detect anomalies, errors, and security threats. - Service Monitoring
Monitor essential services such as HTTP, FTP, SMTP, and DNS to ensure their availability. - Cloud Infrastructure Monitoring
Monitor cloud-based services, including AWS, Azure, and Google Cloud, for resource usage and performance. - Database Monitoring
Track query performance, connection counts, and resource utilization for databases like MySQL, PostgreSQL, and MongoDB. - IoT Device Monitoring
Monitor IoT devices for connectivity, performance, and health metrics. - Business Process Monitoring
Monitor business-critical workflows and transactions to ensure smooth operations. - Security Monitoring
Detect unauthorized access, monitor firewall activity, and analyze intrusion detection system (IDS) logs.

What Are the Features of Nagios?
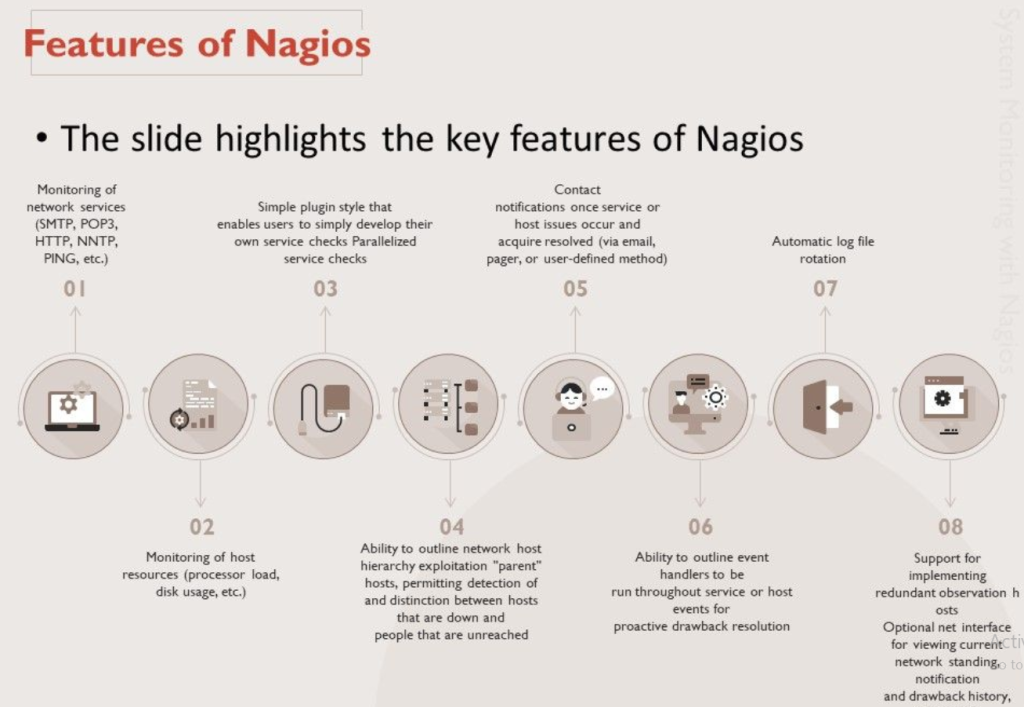
- Comprehensive Monitoring
Monitor servers, applications, networks, and services from a single interface. - Customizable Plugins
Extend Nagios’s capabilities with a wide range of community-developed and custom plugins. - Proactive Alerting
Receive alerts via email, SMS, or other notification methods when issues are detected. - Performance Graphing
Generate visual reports and graphs to analyze historical performance trends. - Role-Based Access Control
Define user roles and permissions to ensure secure access to monitoring data. - Scalability
Scale monitoring across large environments with distributed and redundant configurations. - Integration Ecosystem
Integrate Nagios with third-party tools like Grafana, Prometheus, and ServiceNow for enhanced functionality. - Log and Event Monitoring
Collect and analyze logs for troubleshooting and compliance purposes. - High Availability
Ensure continuous monitoring with failover and redundancy options. - REST API
Use Nagios’s API to automate monitoring tasks and integrate with DevOps pipelines.
How Nagios Works and Architecture
How It Works:
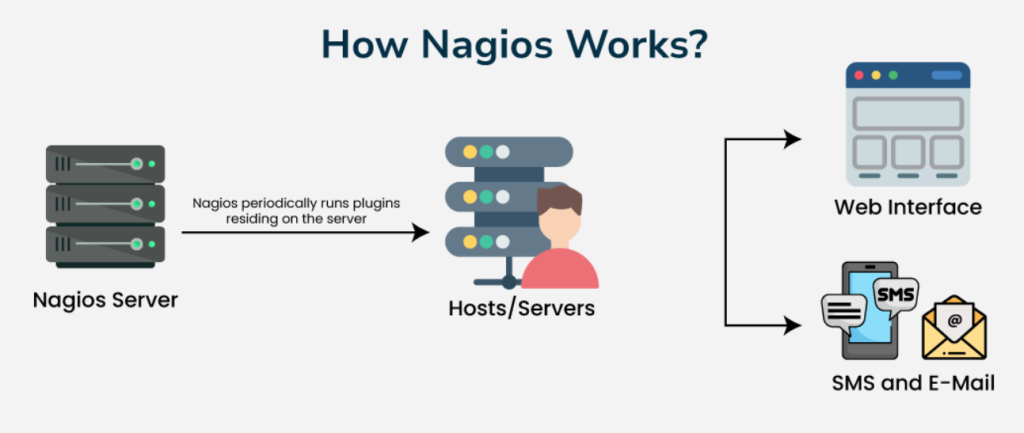
Nagios operates by periodically polling devices, applications, and services to check their status. When an issue is detected, Nagios generates alerts and logs the incident for further analysis. Its modular architecture allows for customization and scalability.
Architecture Overview:
- Nagios Core:
The central monitoring engine that schedules checks, processes results, and generates alerts. - Plugins:
External scripts or programs used to collect data from monitored systems. - Nagios Remote Plugin Executor (NRPE):
A component that allows Nagios to execute checks on remote systems. - Add-Ons:
Tools like Nagios XI (enterprise version), Nagios Log Server, and Nagios Fusion extend functionality. - Web Interface:
A user-friendly dashboard for configuring monitoring, viewing reports, and managing alerts. - Notification System:
Sends alerts via email, SMS, or integrations with messaging platforms.
How to Install Nagios
Steps to Install Nagios on Linux:
1. Update the System:
sudo apt update
sudo apt upgrade
2. Install Prerequisites:
- Install required packages:
sudo apt install -y apache2 php libapache2-mod-php build-essential libgd-dev3. Download Nagios Core:
- Visit the Nagios website and download the latest version.
wget https://assets.nagios.com/downloads/nagioscore/releases/nagios-<version>.tar.gz4. Extract and Compile Nagios:
tar -xvzf nagios-<version>.tar.gz
cd nagios-<version>
./configure --with-command-group=nagcmd
make all
sudo make install
5. Install Plugins:
- Download and install Nagios plugins:
wget https://nagios-plugins.org/download/nagios-plugins-<version>.tar.gz
tar -xvzf nagios-plugins-<version>.tar.gz
cd nagios-plugins-<version>
./configure
make
sudo make install
6. Start Nagios Service:
sudo systemctl start nagios
sudo systemctl enable nagios
7. Access Nagios Web Interface:
- Open your browser and navigate to
http://<your_server_ip>/nagios. - Log in using the default credentials and configure monitoring.
Basic Tutorials of Nagios: Getting Started
1. Adding a Host to Monitor:
- Define a new host in the
nagios.cfgfile:
define host {
  use         linux-server
  host_name   example-server
  alias       Example Server
  address     192.168.1.100
}
2. Setting Up a Service Check:
- Add a service definition to monitor a specific resource:
define service {
  use                 generic-service
  host_name           example-server
  service_description CPU Load
  check_command       check_nrpe!check_load
}
3. Configuring Alerts:
- Define notification settings in the
contacts.cfgfile:
define contact {
  contact_name        admin
  email               admin@example.com
  service_notification_commands notify-service-by-email
}
4. Using NRPE for Remote Checks:
- Install NRPE on the remote system:
sudo apt install nagios-nrpe-server
sudo apt install nagios-nrpe-server- Configure
nrpe.cfgto define remote checks.
5. Creating Custom Plugins:
- Write a custom plugin script:
#!/bin/bash
if [ "$(df / | tail -1 | awk '{print $5}' | sed 's/%//')" -gt 80 ]; then
    echo "CRITICAL: Disk usage is above 80%"
    exit 2
else
    echo "OK: Disk usage is normal"
    exit 0
fi- Save the script in
/usr/local/nagios/libexec.