In modern IT environments, where the volume of machine data generated by applications, systems, and devices is growing exponentially, managing and analyzing this data is crucial for operational efficiency and security. Graylog is a centralized log management and analysis platform that provides powerful tools to collect, index, and analyze log data in real-time. Its flexible architecture and user-friendly interface make it a preferred choice for organizations seeking actionable insights into their IT infrastructure.
Graylog is widely used for monitoring, troubleshooting, security, and compliance purposes. It helps IT teams efficiently manage logs from diverse sources, visualize patterns, detect anomalies, and respond to incidents promptly. Its scalability and open-source nature allow businesses to tailor it to their specific needs, making it an ideal solution for companies of all sizes.
What is Graylog?
Graylog is an open-source log management platform designed to collect, store, and analyze machine-generated data. By centralizing logs from servers, applications, and devices, Graylog enables organizations to monitor their systems, detect and respond to issues, and ensure compliance with regulatory requirements. It provides a web-based interface for managing logs, creating visual dashboards, and configuring alerts.
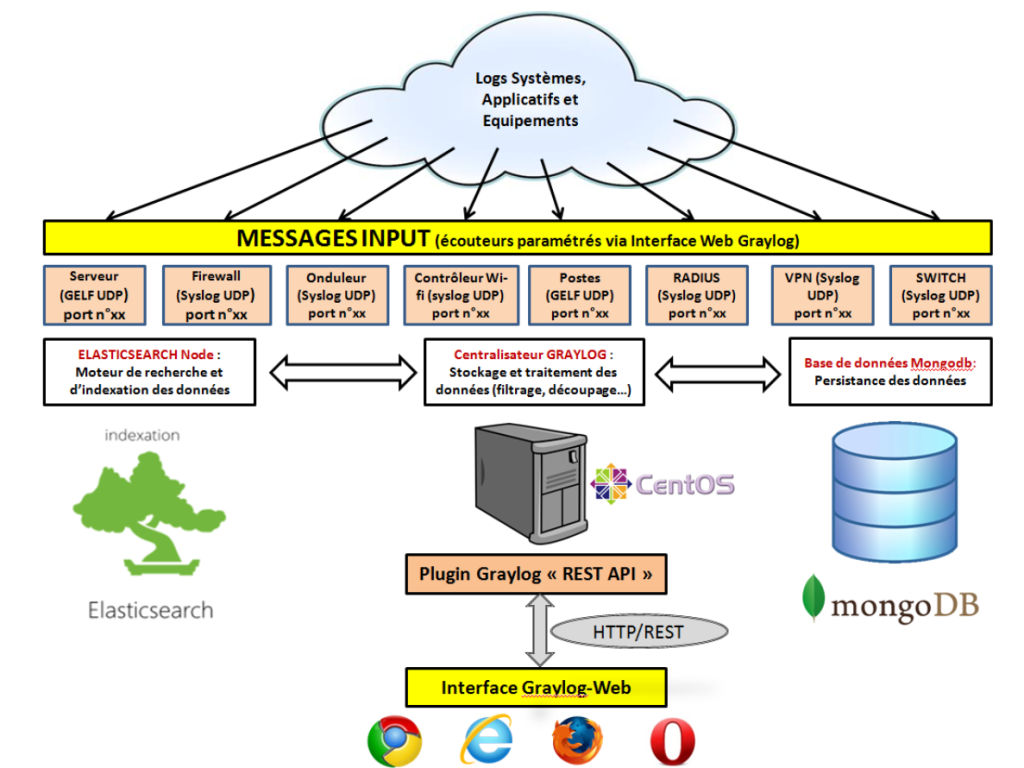
Graylog’s modular design includes a core server for data processing, Elasticsearch for storage and indexing, and MongoDB for configuration data. Its features, such as real-time log collection, querying, and alerting, make it a robust tool for IT operations, security monitoring, and DevOps workflows.
Top 10 Use Cases of Graylog
- Centralized Log Management
Consolidate logs from various systems, such as servers, applications, network devices, and containers, into a single platform for efficient access and analysis. - Application Monitoring
Monitor application logs to identify performance bottlenecks, track user activity, and troubleshoot errors for enhanced user experience. - Security Information and Event Management (SIEM)
Use Graylog to detect, investigate, and respond to security incidents by analyzing logs for suspicious activities and anomalies. - Compliance and Audit Logging
Collect and store logs to meet regulatory requirements such as GDPR, HIPAA, and PCI DSS. Generate reports for audits with ease. - Infrastructure Monitoring
Track the health and performance of IT infrastructure, including servers, storage, and networks, to prevent downtime and optimize resource utilization. - DevOps Observability
Gain visibility into DevOps pipelines, containerized environments, and microservices to ensure smooth deployments and operational efficiency. - Incident Response and Troubleshooting
Analyze logs in real-time to identify and resolve system failures, application crashes, or configuration errors quickly. - Threat Detection and Prevention
Monitor logs for unauthorized access, firewall breaches, and other security threats to protect systems from potential attacks. - IoT Device Monitoring
Manage and analyze logs from IoT devices to ensure connectivity, data integrity, and operational performance. - Business Process Monitoring
Monitor critical business processes, such as financial transactions or order fulfillment workflows, to ensure smooth operations and prevent disruptions.

What Are the Features of Graylog?
- Real-Time Log Ingestion
Graylog collects logs from various sources, including Syslog, application logs, APIs, and IoT devices, in real-time. - Powerful Query Language
Use Graylog’s query language to filter, search, and analyze logs with precision. Query logs based on time range, source, severity, and custom parameters. - Customizable Dashboards
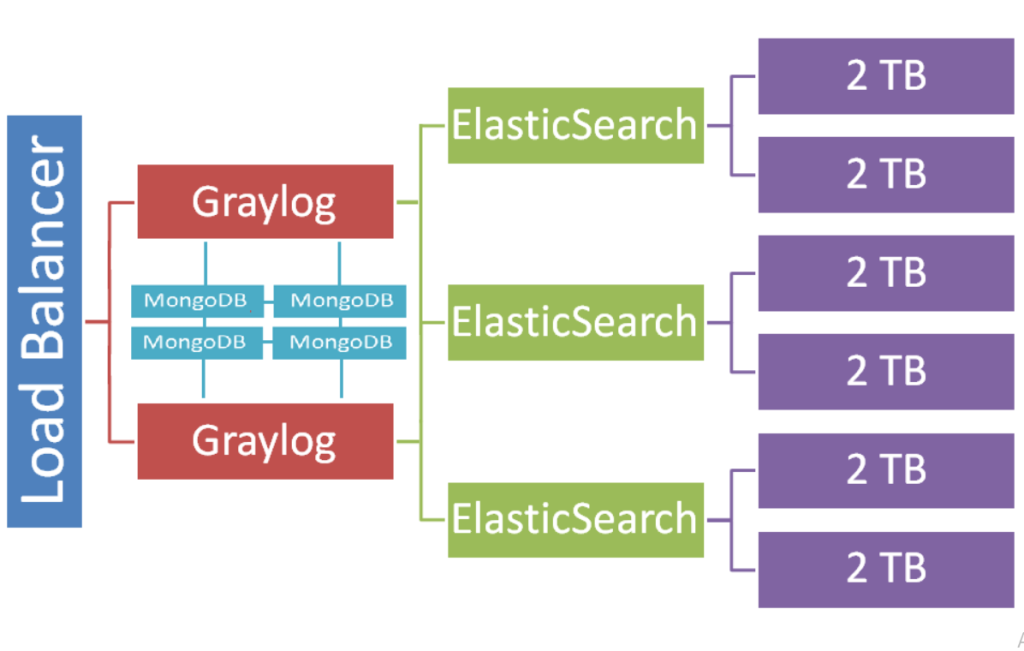
Create intuitive dashboards with graphs, charts, and widgets to visualize key metrics and monitor trends. - Scalability and High Availability
Handle large-scale environments with Graylog’s distributed architecture and clustering capabilities, ensuring uninterrupted monitoring. - Alerting and Notifications
Configure alerts for specific conditions or thresholds, and integrate with tools like Slack, PagerDuty, or email to notify teams in real-time. - Role-Based Access Control (RBAC)
Manage user access and permissions to ensure secure handling of sensitive log data. - Log Enrichment and Parsing
Use Graylog’s built-in capabilities to parse, normalize, and enrich logs for better analysis and visualization. - Integration Ecosystem
Integrate Graylog with tools like Elasticsearch, Grafana, and Splunk to enhance its functionality and extend its use cases. - Index Management
Efficiently index and archive logs for quick retrieval and long-term storage, supporting compliance and auditing needs. - Open-Source and Community Support
Leverage Graylog’s open-source model and active community for custom plugins, updates, and troubleshooting assistance.
How Graylog Works and Architecture
How It Works:
Graylog collects raw log data from multiple sources and processes it into a structured format for storage and analysis. Users can query and visualize this data through an intuitive web-based interface, enabling faster troubleshooting and decision-making.
Architecture Overview:
- Graylog Server:
The central component responsible for processing incoming logs, managing user interactions, and generating visualizations. - Input Collectors:
Tools like Graylog Sidecar collect logs from various sources, such as Syslog, network devices, and file-based logs, and forward them to the Graylog Server. - Elasticsearch:
Acts as the backend storage for indexed log data, enabling fast search and retrieval. - MongoDB:
Stores configuration data, such as user settings, input definitions, and alert configurations. - Web Interface:
Provides a graphical dashboard for querying logs, creating visualizations, and managing alerts. - Plug-and-Play Integrations:
Support for numerous data sources and plugins ensures flexibility in deployment.
How to Install Graylog
Steps to Install Graylog on Linux:
1. Install Java:
Java is a prerequisite for Graylog. Install it using:
sudo apt update
sudo apt install openjdk-11-jdk
2. Install MongoDB:
MongoDB stores configuration data:
sudo apt install -y mongodb
sudo systemctl start mongodb
sudo systemctl enable mongodb
3. Install Elasticsearch:
Elasticsearch is used for indexing log data:
wget https://artifacts.elastic.co/downloads/elasticsearch/elasticsearch-7.x.deb
sudo dpkg -i elasticsearch-7.x.deb
sudo systemctl start elasticsearch
sudo systemctl enable elasticsearch
4. Install Graylog:
Add the Graylog repository and install Graylog:
wget https://packages.graylog2.org/repo/packages/graylog-4.x-repository_latest.deb
sudo dpkg -i graylog-4.x-repository_latest.deb
sudo apt update
sudo apt install graylog-server
5. Configure Graylog:
Edit the server.conf file:
sudo nano /etc/graylog/server/server.conf6. Start Graylog:
sudo systemctl start graylog-server
sudo systemctl enable graylog-server
7. Access Graylog Dashboard:
Open a browser and navigate to http://<your_server_ip>:9000. Log in with the admin credentials.
Basic Tutorials of Graylog: Getting Started
1. Setting Up Inputs:
- Navigate to “System” > “Inputs” and select a data source (e.g., Syslog UDP).
- Configure the input to start collecting logs.
2. Creating Dashboards:
- Use the “Dashboards” section to create a new dashboard.
- Add widgets for visualizing log trends, error counts, or system performance.
3. Running Queries:
- Use Graylog’s search functionality to filter logs:
source:server1 AND severity:ERROR4. Configuring Alerts:
- Define alert conditions based on specific thresholds or patterns.
- Set up notification channels like email or Slack for instant alerts.
5. Integrating Plugins:
- Extend Graylog’s capabilities by installing plugins from the Graylog Marketplace.
6. Visualizing Metrics with Grafana:
- Integrate Graylog with Grafana for advanced visualizations and detailed reporting.