In today’s rapidly evolving technological landscape, businesses face increasing pressure to maintain high-performing applications. Every downtime or performance issue not only disrupts service but also impacts the user experience and, ultimately, the bottom line. As applications become more complex—spanning cloud environments, microservices, and hybrid systems—managing and monitoring performance becomes increasingly challenging. This is where AppDynamics, a comprehensive Application Performance Management (APM) solution, plays a critical role.
AppDynamics helps organizations gain deep visibility into their applications, infrastructure, and end-user experiences by continuously monitoring and managing performance. With real-time insights and powerful analytics, AppDynamics empowers IT teams to proactively identify performance bottlenecks, resolve issues before they impact users, and ensure optimal performance across the entire application stack. In this blog, we will explore what AppDynamics is, its use cases, core features, architecture, and installation process, and provide you with a basic tutorial to get started.
What is AppDynamics?
AppDynamics is an advanced Application Performance Management (APM) tool designed to monitor, optimize, and troubleshoot the performance of applications, databases, and infrastructure. In a modern digital ecosystem where apps run across multiple platforms—cloud, on-premise, hybrid, or microservices architectures—AppDynamics provides a unified, end-to-end solution to track everything from the user interface to the backend servers.
Through its advanced analytics engine, AppDynamics delivers real-time insights into the health of applications, helping businesses detect performance bottlenecks, track user interactions, and optimize infrastructure resources. AppDynamics supports a wide range of programming languages (including Java, .NET, Node.js, PHP, and Python) and can seamlessly integrate with cloud platforms like AWS, Microsoft Azure, and Google Cloud, making it an essential tool for organizations seeking to maintain and optimize the performance of their applications, regardless of their infrastructure environment.
Top 10 Use Cases of AppDynamics:
- Application Performance Monitoring (APM): AppDynamics provides real-time monitoring of applications, ensuring that performance is tracked constantly. It identifies slow response times, errors, and bottlenecks in transactions, offering visibility into how applications perform under different conditions. This is especially important for mission-critical applications where even a minor delay could affect users and business operations.
- Real-Time Troubleshooting and Diagnostics: One of the most valuable aspects of AppDynamics is its ability to provide real-time insights. IT teams can identify issues as they arise and quickly trace the root cause of performance problems. Whether it’s a slow database query, a memory leak, or an external API failure, AppDynamics helps isolate and resolve problems swiftly to minimize downtime.
- End-User Experience Monitoring (EUM): AppDynamics tracks user interactions with applications, providing insights into the end-user experience. This includes monitoring page load times, interaction delays, and crashes, helping businesses optimize user experiences and ensure they meet performance expectations. With this data, organizations can adjust their apps to deliver smoother and faster user journeys.
- Cloud Monitoring: As organizations move to the cloud, ensuring the performance of cloud-based applications becomes increasingly complex. AppDynamics seamlessly integrates with cloud platforms such as AWS, Google Cloud, and Azure, providing visibility into cloud-hosted services, virtualized environments, and containerized applications.
- Business Transaction Monitoring: AppDynamics tracks critical business transactions end-to-end. This allows organizations to monitor vital interactions such as customer purchases, data transfers, or API calls, which directly affect business revenue and customer satisfaction. By analyzing these transactions, businesses can identify areas of improvement and ensure that business-critical processes run smoothly.
- Synthetic Monitoring: In addition to monitoring live user interactions, AppDynamics offers synthetic monitoring, which simulates user actions to test the application’s performance from various locations. This proactive approach helps businesses catch performance issues before real users experience them, reducing the risk of customer dissatisfaction.
- Microservices and Container Monitoring: With the rise of microservices and containers, monitoring has become more complex. AppDynamics provides robust support for monitoring microservices, Kubernetes, Docker, and other containerized applications, helping teams track performance across these dynamic environments.
- Database Performance Monitoring: AppDynamics offers in-depth visibility into database performance, helping businesses track query execution times, identify slow queries, and monitor database response times. By optimizing database performance, organizations can prevent application bottlenecks that are often caused by inefficient database queries.
- Root Cause Analysis and Diagnostics: When performance issues arise, AppDynamics automatically traces business transactions across various tiers of an application, allowing teams to quickly pinpoint the root cause of the problem. Whether it’s a network issue, server misconfiguration, or faulty application code, AppDynamics accelerates the identification of the problem and streamlines the resolution process.
- Compliance Monitoring: AppDynamics also helps businesses meet compliance and regulatory requirements by tracking data flows, ensuring that applications are operating within set performance thresholds, and maintaining performance standards that meet industry regulations (such as GDPR, HIPAA, and PCI DSS).
What are the Features of AppDynamics?
AppDynamics offers a wide range of features designed to help businesses gain complete visibility into their application’s performance. Here’s a breakdown of some of its key features:
- Real-Time Application Monitoring: AppDynamics provides continuous monitoring of application performance and delivers real-time data about application health, allowing businesses to address issues as soon as they occur.
- End-to-End Transaction Tracking: The platform tracks every business transaction from start to finish, offering visibility into how transactions flow across the application stack. This helps businesses identify and fix issues affecting critical processes.
- Custom Dashboards: Users can create custom dashboards to monitor key performance indicators (KPIs) and track critical metrics. These dashboards help businesses stay on top of application performance at a glance.
- Root Cause Diagnostics: When a problem arises, AppDynamics automatically traces the transaction journey and pinpoints the root cause, helping IT teams quickly fix performance bottlenecks without wasting time on guesswork.
- Cloud Monitoring: AppDynamics seamlessly integrates with cloud environments, providing comprehensive visibility into cloud-based applications and ensuring optimal performance in dynamic, hybrid cloud environments.
- Business and Infrastructure Analytics: The platform provides both business transaction and infrastructure monitoring, allowing businesses to understand how application performance impacts business goals and how infrastructure resources are utilized.
- Alerts and Automation: AppDynamics allows users to set up alerts based on performance thresholds. When performance drops below acceptable levels, AppDynamics can notify the team immediately, ensuring that issues are addressed proactively.
- Database Monitoring: It offers in-depth database performance analysis, allowing businesses to identify slow queries and optimize their database resources for better performance.
- Synthetic and Real User Monitoring: The combination of synthetic monitoring and real-user monitoring helps businesses ensure that their applications perform optimally, both in test environments and in production.
- Application Mapping and Visualization: AppDynamics automatically maps applications to give teams a visual representation of how transactions flow through the system. This allows users to quickly identify where issues occur within the application.

How AppDynamics Works and Architecture?
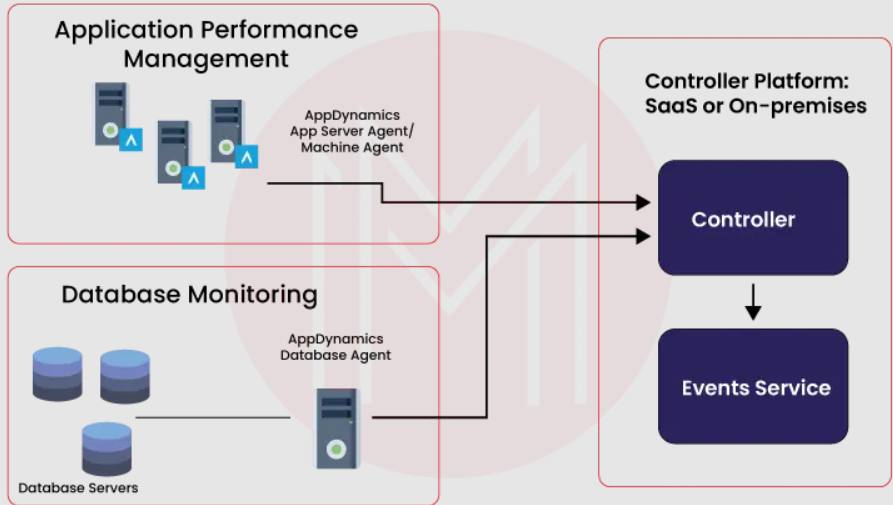
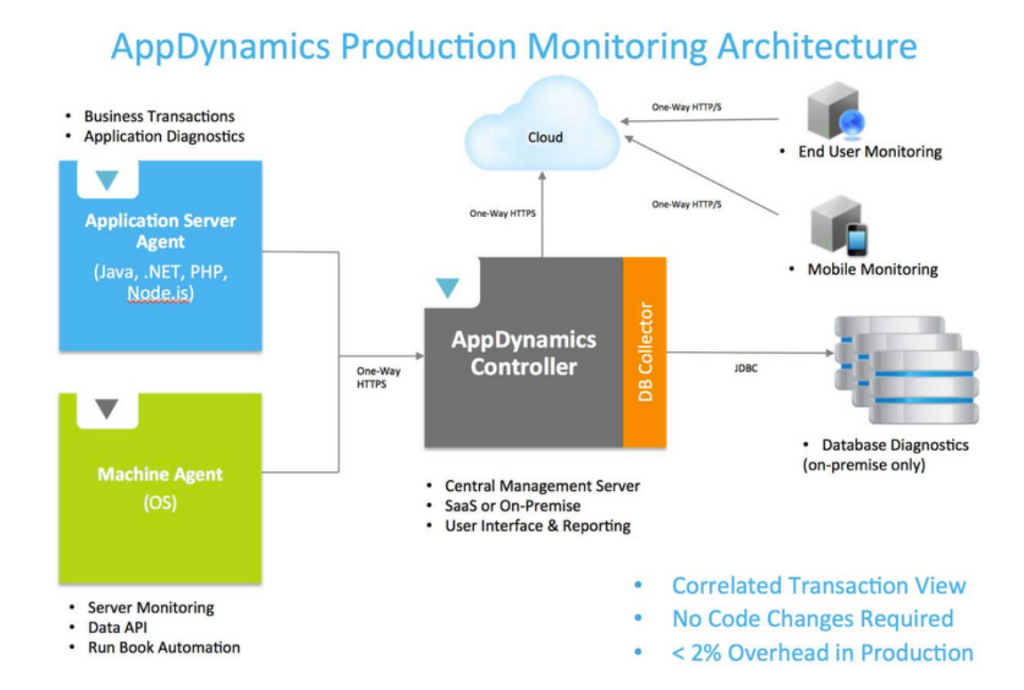
AppDynamics operates on a client-server architecture designed to monitor applications, databases, and infrastructure components. Here’s a high-level look at how it works:
- AppDynamics Controller: The Controller is the heart of the system, storing all monitoring data and providing actionable insights. It processes data collected from agents and visualizes it in dashboards, reports, and real-time alerts.
- AppDynamics Agents: AppDynamics uses lightweight agents deployed on application servers (Java, .NET, Node.js, PHP, etc.) to monitor the application’s performance. These agents collect real-time performance data and communicate it back to the Controller.
- Transaction Analytics: AppDynamics analyzes transactions from end to end, tracking the interaction between application components, databases, APIs, and services. By understanding how these transactions flow, it helps businesses identify bottlenecks and optimize processes.
- Data Analytics Engine: The analytics engine processes the data from the agents, providing businesses with insights into trends, root causes of issues, and recommendations for improvement.
- Dashboards: Interactive dashboards provide an intuitive interface to visualize the health of applications, business transactions, and infrastructure components in real-time.
How to Install AppDynamics?
Here’s a concise guide on how to install AppDynamics:
Steps to Install AppDynamics:
- Sign Up for AppDynamics:
- Go to the AppDynamics website and sign up for an account or request a free trial.
- Download the AppDynamics Agent:
- Once logged in, navigate to the “Get Started” section or the Downloads page.
- Select the appropriate agent based on your environment (Java, .NET, Node.js, Python, etc.).
- Download the AppDynamics agent for your server or cloud environment.
- Install the Agent:
- For Java Applications:
- Unzip the downloaded agent package.
- Add the following Java Virtual Machine (JVM) argument to your application’s startup script:
- For Java Applications:
-javaagent:/path/to/agent.jar- For Other Environments (e.g., .NET, Node.js, etc.):
- Follow the specific instructions provided by AppDynamics for the type of agent you are installing. The setup typically involves adding environment variables or modifying configuration files.
- Configure the Agent:
- After installing, configure the agent to point to your AppDynamics controller (which handles data collection and analysis). You’ll need to provide the Controller Host, Port, and Application Name.
- Verify the Installation:
- Restart your application with the agent enabled.
- Log in to your AppDynamics account and go to the Applications dashboard.
- Check if the application is listed and data is being collected (e.g., response times, error rates, etc.).
- Access the Dashboard:
- You can view the performance metrics, including transaction tracking, infrastructure monitoring, and real-time user insights, through the AppDynamics web interface.
Additional Setup (Optional):
- Configure Alerts and Dashboards: Set up custom alerts and dashboards to monitor specific metrics that are crucial for your business.
Basic Tutorials of AppDynamics: Getting Started
- Getting Familiar with the Dashboard: Once you’ve installed AppDynamics and connected your applications, take the time to explore the dashboard. The dashboard offers a variety of metrics, including response times, error rates, and system load.
- Create Custom Dashboards: Learn how to set up custom dashboards that show critical performance data for your applications. These dashboards allow you to track metrics relevant to your business and IT needs.
- Set Up Alerts: Set thresholds for key performance indicators (KPIs) and configure alerts to notify your team when performance issues arise.
- Monitor Key Business Transactions: Define your business-critical transactions and monitor their performance in real time.
- Perform Root Cause Analysis: Use AppDynamics’ automated root cause analysis to detect and resolve performance issues quickly.
- Monitor Microservices and Cloud Environments: Learn how to monitor microservices and cloud platforms like AWS and Azure to ensure that all your modern applications are functioning as expected.