Introduction
In an increasingly digital world, the speed and reliability of web applications and websites are critical to business success. If users encounter slow load times or downtime, it can result in lost revenue, decreased customer satisfaction, and damaged reputations. To avoid these pitfalls, businesses need powerful tools that help monitor and optimize their web application performance.
Apica is one such tool that provides advanced website and application monitoring with a focus on performance analytics. By leveraging synthetic monitoring, real-time user monitoring, and detailed insights into API performance, Apica helps businesses ensure their web services operate smoothly at all times. This blog explores what Apica is, its top 10 use cases, key features, architecture, installation process, and how to get started with Apica.
What is Apica?
Apica is a performance monitoring tool designed to optimize the user experience for websites and applications. Through its advanced monitoring capabilities, Apica provides real-time insights into the performance, availability, and user interactions with web applications. Apica enables businesses to proactively identify performance issues, minimize downtime, and optimize user experience by offering visibility into website load times, API performance, and other key performance metrics.
At its core, Apica uses synthetic monitoring to simulate user interactions with a website or web application and measures response times, availability, and functionality. Apica also provides detailed performance metrics, including data from real user monitoring (RUM), allowing businesses to track the real-world user experience and optimize performance.
Top 10 Use Cases of Apica
Apica is a versatile tool that businesses can use for various aspects of performance monitoring and optimization. Below are the top 10 use cases for Apica:
1. Website and Application Uptime Monitoring
Apica helps businesses ensure their websites and applications are always accessible. By simulating user interactions from multiple locations, Apica checks whether your website is up and running, alerting you immediately in case of downtime.
2. End-User Experience Monitoring
Apica provides valuable insights into the user experience by simulating how real users interact with your website or application. It measures key factors like page load times, response times, and transaction completions, helping you understand the performance from the user’s perspective.
3. API Performance Monitoring
For businesses that rely on APIs to deliver services, Apica tracks the performance of APIs, ensuring that they are available, responsive, and functioning as expected. This use case is particularly useful for monitoring third-party API integrations or internal API services.
4. Load Time and Performance Optimization
Apica tracks website and application load times and provides recommendations for optimization. By simulating real user interactions, it identifies bottlenecks and slow-loading elements, which can then be optimized to improve overall performance and reduce latency.
5. Synthetic Transaction Monitoring
With Apica’s synthetic monitoring, you can simulate multi-step user transactions such as account logins, shopping cart processes, and form submissions. By automating these tests, you can ensure critical user workflows are functioning properly and quickly identify issues before they impact users.
6. Global Performance Monitoring
Apica uses a network of monitoring locations around the world, ensuring that your website or application’s performance is evaluated from a global perspective. By monitoring from multiple geographic locations, Apica helps identify regional performance issues, allowing you to optimize your web services for a global audience.
7. Continuous Availability Monitoring
Apica provides continuous monitoring of your websites and applications, ensuring that they are available 24/7. Continuous monitoring helps detect intermittent downtime and performance issues that could affect users during off-hours or peak traffic times.
8. SLA and Compliance Monitoring
Many businesses have Service Level Agreements (SLAs) or regulatory compliance requirements related to website performance, uptime, and availability. Apica helps monitor your systems against these requirements, providing detailed reports that ensure your service meets agreed-upon performance levels.
9. Mobile Application Performance Monitoring
Apica’s monitoring capabilities extend to mobile applications, allowing you to track the availability and performance of mobile websites and apps. This ensures that mobile users experience fast load times, smooth interactions, and a seamless experience while using your services.
10. Alerting and Incident Management
Apica provides advanced alerting capabilities that notify teams when issues arise, such as downtime, slow performance, or failed transactions. Alerts can be configured to notify teams via email, SMS, or integrations with incident management tools like Slack, PagerDuty, or Opsgenie, helping you take immediate action to resolve issues.
What Are the Features of Apica?
Apica comes equipped with a wide array of features that make it a powerful solution for performance monitoring and optimization. Some of the key features include:
- Real-Time Monitoring: Get insights into the real-time performance and availability of your websites, applications, and APIs.
- Synthetic Monitoring: Simulate user interactions with your site and track availability, response times, and error rates.
- End-User Experience (RUM): Monitor real user interactions to understand how your site performs for actual visitors.
- Global Monitoring Locations: Run tests from various locations around the world to assess your site’s performance on a global scale.
- Multi-Step Transaction Monitoring: Simulate complex user journeys, such as logging in, making a purchase, or completing a form submission, to ensure they work correctly.
- API Performance Tracking: Track the availability and response times of your APIs to ensure they are performing optimally.
- Alerting and Notifications: Set up alerts to notify your team immediately when performance issues or downtime occur.
- Detailed Performance Reports: Access comprehensive reports with performance metrics, including load times, response times, and availability data.
- Mobile Monitoring: Monitor the performance and availability of mobile websites and applications to ensure seamless experiences for mobile users.
- SLA Monitoring: Track the performance of your services against Service Level Agreements (SLAs) and ensure you meet your commitments to users.

How Apica Works and Architecture
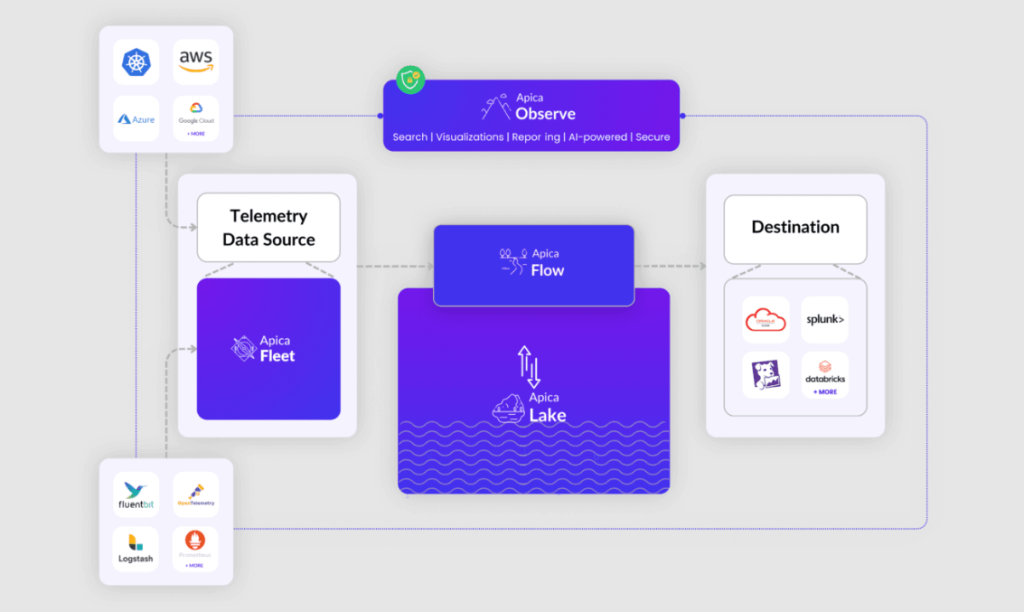
Apica works by simulating user interactions on your website or application and gathering performance data from these interactions. Here’s how Apica’s architecture functions:
- Global Monitoring Locations: Apica uses a network of monitoring locations to run synthetic tests, simulating user visits from different geographic regions. This gives you a global view of how your website or application performs from different parts of the world.
- Synthetic Monitoring Scripts: Apica’s synthetic tests are powered by customizable scripts that simulate real user journeys. These scripts can test everything from page load times to complex multi-step transactions.
- Real-Time Data Collection: Once tests are completed, Apica collects real-time data on metrics like page load times, availability, response times, and errors. This data is sent to the Apica dashboard for analysis.
- Alerting System: Apica can send real-time alerts via email, SMS, or integrations with other tools when performance issues, downtime, or errors are detected. Alerts can be customized based on the severity of the issue.
- Unified Dashboard: All the collected data is displayed on Apica’s unified dashboard, where you can view detailed performance metrics, analyze trends, and access historical data.
- Integration with Other Tools: Apica integrates with other monitoring and incident management tools, such as Datadog, Slack, PagerDuty, and more, allowing you to centralize your monitoring and streamline incident management.
How to Install Apica?
Installing Apica is simple as it is a cloud-based service, which means there is no need for traditional installation on your servers. Here are the steps to get started:
- Sign Up for Apica:
- Go to the Apica website and create an account. You can start with a free trial or choose the plan that suits your needs.
- Add Your Website or Application:
- After logging in to the Apica dashboard, click “Add Monitor” to start monitoring your website or web application.
- Enter the URL of your website and configure the monitoring intervals (e.g., every 5 minutes).
- Write Synthetic Monitoring Scripts:
- Create custom scripts that simulate user interactions with your website. These scripts can include tasks such as loading a page, logging in, or completing a transaction.
- Configure Global Locations:
- Select the global monitoring locations from which to run your tests. Apica offers numerous monitoring locations worldwide.
- Set Up Alerts:
- Configure alert thresholds and notifications for when performance issues or downtime are detected. You can set up alerts for things like slow response times, errors, or downtime.
- Start Monitoring:
- Once your monitors are configured, Apica will begin running tests and collecting performance data. You can view the results on your dashboard in real-time.
Basic Tutorials of Apica: Getting Started
Once you’ve set up Apica, follow these steps to get started with some basic features:
1. Create a Synthetic Monitor:
- From the dashboard, click on “Add Monitor” and choose your monitor type (e.g., URL, API, or multi-step transaction).
- Enter the URL or API endpoint and set the frequency of tests (e.g., every 5 minutes).
2. Write a Script for Multi-Step Transactions:
- Use Apica’s built-in scripting tools to write a script that simulates a multi-step transaction such as completing a purchase.
- Add steps like logging in, adding products to the cart, and proceeding to checkout.
3. Set Alerts for Downtime or Performance Issues:
- Configure alert conditions based on specific performance metrics (e.g., if response time exceeds a certain threshold).
- Set up notification channels such as email, SMS, or Slack for real-time alerts.
4. Monitor Performance and View Reports:
- Use the Apica dashboard to monitor your website or application’s performance, including page load times, transaction times, and availability.
- Review detailed reports to identify performance bottlenecks and optimize your service.