Introduction
In today’s data-driven world, the ability to analyze and visualize data is more important than ever. Businesses, organizations, and individuals rely on data insights to make informed decisions and drive strategic initiatives. However, making sense of vast amounts of raw data can be a daunting task without the right tools.
Tableau is one of the leading data visualization tools that helps users transform raw data into meaningful insights through interactive, easy-to-understand visualizations. Whether you’re a business executive, data analyst, or researcher, Tableau enables you to visualize data in ways that facilitate decision-making, performance tracking, and predictive analysis.
In this blog post, we will explore what Tableau is, the top 10 use cases for Tableau, its features, how Tableau works and its architecture, the process to install Tableau, and provide you with basic tutorials to get started with Tableau.
What is Tableau?
Tableau is a powerful data visualization tool that enables businesses and individuals to analyze and visualize data in a dynamic, interactive way. It offers a wide array of features that allow users to create visually appealing dashboards, reports, and charts to gain deeper insights into their data. Tableau can connect to a variety of data sources, including spreadsheets, databases, cloud services, and big data platforms, allowing users to work with data from multiple systems in real time.
Tableau allows users to drag and drop data fields to create interactive visualizations, such as bar charts, pie charts, line graphs, heat maps, and more. These visualizations help to communicate complex insights quickly and efficiently, making data analysis more accessible to non-technical users.
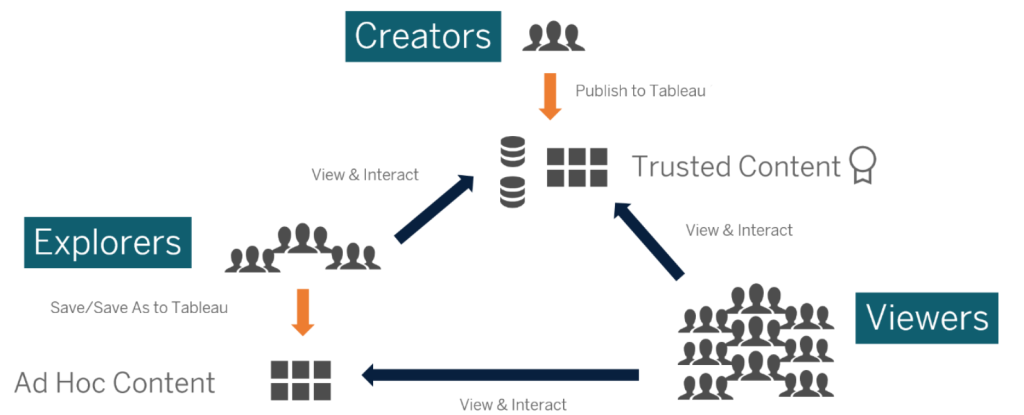
Tableau comes in different versions, including Tableau Desktop (for individual use), Tableau Server (for sharing visualizations in an organization), and Tableau Online (a cloud-based version for collaboration).
Top 10 Use Cases of Tableau
Tableau’s versatility makes it applicable in a wide range of industries and business functions. Here are the top 10 use cases where Tableau excels:
1. Business Intelligence (BI) and Reporting
Tableau is widely used for business intelligence, as it allows organizations to collect, analyze, and visualize large amounts of data. Users can create interactive dashboards and reports to monitor business performance, track key metrics, and make data-driven decisions. Tableau simplifies the process of creating reports, making it accessible even for non-technical users.
2. Financial Analysis and Planning
Financial professionals use Tableau to visualize financial data, track performance, and forecast trends. Tableau helps analyze key financial metrics such as revenue, expenses, profits, and cash flow. Interactive visualizations enable financial analysts to identify patterns, conduct variance analysis, and perform scenario planning.
3. Sales and Marketing Analytics
Sales and marketing teams use Tableau to track key performance indicators (KPIs) such as customer acquisition, lead conversion rates, marketing campaigns’ effectiveness, and sales pipeline performance. Tableau helps businesses identify target audiences, optimize sales strategies, and monitor the success of marketing efforts by visualizing customer data, trends, and outcomes.
4. Supply Chain and Operations Management
In supply chain management, Tableau is used to track inventory, monitor logistics, and improve operational efficiency. Businesses can create visualizations that show real-time data on shipments, delivery times, inventory levels, and supplier performance. Tableau helps optimize supply chain processes and improve decision-making related to procurement, demand forecasting, and production planning.
5. Customer Segmentation and Behavior Analysis
Tableau is used to analyze customer data to identify key segments and target groups. Businesses can visualize customer preferences, purchasing behaviors, and engagement patterns. This helps in tailoring marketing strategies, personalizing offers, and enhancing customer satisfaction by understanding their needs and demands.
6. Healthcare Data Analysis
Healthcare providers and organizations use Tableau to analyze patient data, track healthcare outcomes, and monitor key performance indicators (KPIs). Visualizing patient care data, hospital operations, and treatment efficacy helps improve patient outcomes, optimize hospital performance, and enhance healthcare delivery.
7. Human Resources (HR) Analytics
HR professionals use Tableau to monitor workforce data, such as employee performance, turnover rates, and hiring trends. Tableau can help create visualizations that track employee satisfaction, analyze compensation and benefits data, and assess the effectiveness of HR policies and recruitment strategies.
8. Government and Public Sector Analytics
Governments and public sector organizations use Tableau for policy analysis, resource allocation, and data transparency. Tableau enables governments to track social services, crime statistics, health outcomes, and public safety measures. Data visualizations help in communicating information to the public, driving policy decisions, and improving public services.
9. Big Data Analytics
Tableau integrates with big data platforms, such as Hadoop, to help users analyze and visualize vast amounts of structured and unstructured data. Tableau helps make sense of complex data sets by visualizing them in a digestible format, allowing businesses to uncover trends, insights, and hidden patterns within big data.
10. Predictive Analytics and Forecasting
Tableau is often used for predictive analytics, enabling users to forecast future trends, behaviors, and outcomes. By integrating with statistical models and machine learning tools, Tableau allows businesses to visualize predictions related to sales, customer behavior, market trends, and more.
What Are the Features of Tableau?
Tableau is packed with powerful features that make it an industry leader in data visualization. Some of the key features include:
- Drag-and-Drop Interface: Easily build interactive dashboards and visualizations without any coding knowledge.
- Data Connectivity: Connects to a wide range of data sources, including Excel, SQL databases, cloud services, and big data platforms.
- Interactive Dashboards: Create dashboards with interactive filters, drill-downs, and high-level views, allowing users to explore data.
- Real-Time Data Processing: Tableau supports live data connections and real-time analytics, providing up-to-date insights.
- Data Blending: Combine data from multiple sources to get a comprehensive view of your business.
- Advanced Analytics: Tableau supports calculations, trend lines, forecasting, and regression analysis, providing advanced analytics capabilities.
- Collaboration Features: Share dashboards and reports securely with others using Tableau Server or Tableau Online.
- Mobile Access: Tableau provides mobile apps that allow users to view and interact with dashboards on smartphones and tablets.
- Storytelling: Create data-driven stories with your visualizations to guide users through key insights.
- Custom Visualizations: Build custom visualizations and integrate third-party extensions to meet specific business needs.

How Tableau Works and Architecture
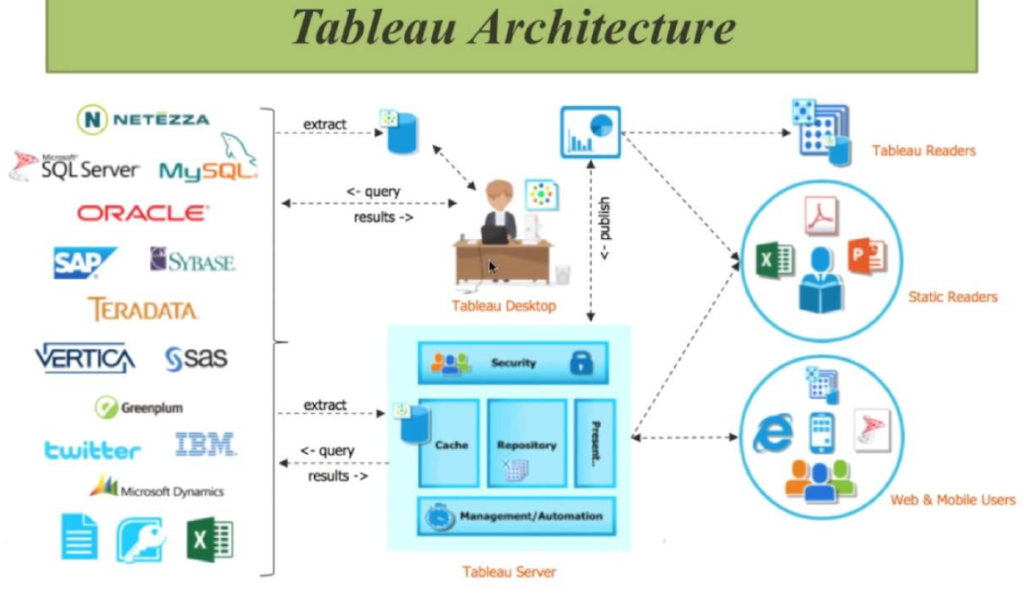
Tableau’s architecture is designed for both individual users and organizations looking for enterprise-grade analytics solutions. The architecture can be broken down into the following components:
- Tableau Desktop: The desktop application used by individual users for building visualizations and dashboards. It allows users to connect to data sources, prepare data, and create visualizations.
- Tableau Server: A centralized platform for sharing and collaborating on Tableau workbooks and dashboards. It allows multiple users to access and interact with reports created in Tableau Desktop.
- Tableau Online: A cloud-based version of Tableau Server, allowing users to share dashboards and collaborate in a web-based environment.
- Tableau Public: A free version of Tableau that allows users to create and share visualizations online. It is mainly used for public data projects and educational purposes.
- Tableau Data Engine: Tableau’s in-memory data engine that enables fast data processing and analytics. It works by optimizing data queries and processing large datasets efficiently.
- Data Connectors: Tableau supports numerous connectors to various data sources, including relational databases, cloud services, and big data platforms, ensuring easy data access and integration.
How to Install Tableau?
To install Tableau on your system, follow these steps based on the version you are using (Tableau Desktop, Tableau Server, or Tableau Public). Here, we’ll cover the installation process for Tableau Desktop.
Step 1: Download Tableau
- Visit the Tableau Website:
- Go to the Tableau download page to get the installation file.
- Choose Your Version:
- If you’re a new user, you can download the free trial version of Tableau Desktop for 14 days.
- If you already have a Tableau account, you can download the latest stable release or access a previous version through the customer portal.
- Sign Up or Log In:
- If prompted, sign up for a Tableau account, or log in if you already have one.
Step 2: Install Tableau Desktop
- Run the Installer:
- After downloading the setup file, double-click on the installer file to run it.
- For Windows, the file will typically be named something like
TableauDesktop-installer.exe. - For Mac, the file will be a
.dmgfile.
- Follow the Installation Wizard:
- For Windows:
- The installation wizard will guide you through the setup process. Click Next to proceed with the default installation options.
- Select the installation folder and click Install. It will take a few minutes for the installation to complete.
- For Mac:
- Open the
.dmgfile and drag the Tableau Desktop application into your Applications folder.
- Open the
- For Windows:
- Complete the Installation:
- Once installed, click Finish on the installer for Windows or close the installation window for Mac.
Step 3: Activate Tableau
- Launch Tableau Desktop:
- Open Tableau Desktop by clicking on the application icon on your desktop or in the Start Menu (Windows) or Applications Folder (Mac).
- Activate Your Product:
- Upon opening Tableau, you will be prompted to enter an activation key.
- If you have purchased Tableau, you should have received an activation key via email. Enter the key to activate Tableau.
- If you’re using the free trial, Tableau will automatically start the trial version.
- Sign In to Your Tableau Account (Optional):
- You can also sign in to your Tableau Account to synchronize your settings and access Tableau Server or Tableau Online resources.
Step 4: Start Using Tableau
- Begin Your First Project:
- Once activated, you can start using Tableau to connect to your data sources, create visualizations, and analyze your data.
- You can connect to various data sources like Excel, SQL databases, Google Analytics, and many more.
- Explore Tableau’s Learning Resources:
- Tableau provides a variety of tutorials and training materials to help you get started.
- You can access these resources directly from the Tableau Help menu or via the Tableau Learning website.
Step 5: Keep Tableau Updated
- Check for Updates:
- To ensure you’re using the latest version of Tableau, periodically check for updates. Tableau will usually notify you when a new version is available.
- You can also manually check for updates by going to Help > Check for Updates in the Tableau Desktop menu.
Basic Tutorials of Tableau: Getting Started
Here are some basic tutorials to help you get started with Tableau:
1. Creating Your First Dashboard:
- Open Tableau and connect to your data source.
- Drag fields from the data pane onto the rows and columns shelves to create visualizations.
- Use the “Show Me” panel to choose the best visualization type for your data (e.g., bar chart, line graph, heatmap).
- Create a dashboard by dragging multiple visualizations onto a single canvas.
2. Adding Filters to Your Dashboard:
- Add filters to your dashboard to allow users to interact with the data and focus on specific subsets.
- Drag a field (e.g., date, region, product category) to the “Filters” shelf and configure how the filter should behave.
3. Building Calculated Fields:
- Create calculated fields to perform custom calculations based on your data.
- Go to the data pane, right-click, and select “Create Calculated Field.” Use Tableau’s formula editor to write your calculation.
4. Sharing Your Tableau Visualizations:
- Once you’ve built your visualizations and dashboards, you can share them by publishing to Tableau Server or Tableau Online.
- Alternatively, export your dashboard as a PDF or image file to share with others.