Introduction
In the modern IT landscape, data is being generated at an unprecedented rate. The ability to effectively analyze and visualize this data is essential for businesses to stay competitive, understand their operations, and make data-driven decisions. One of the key tools for visualizing and interacting with data, especially in the context of Elasticsearch, is Kibana.
Kibana is a powerful open-source data visualization tool designed to work with Elasticsearch. It provides a user-friendly interface to search, view, and analyze data stored in Elasticsearch indexes. With its real-time data processing and interactive dashboards, Kibana makes it easier for businesses to identify trends, monitor systems, and gain insights from their data. In this blog post, we will explore what Kibana is, its top 10 use cases, its features, how Kibana works, the installation process, and provide a basic tutorial to help you get started with Kibana.
What is Kibana?
Kibana is an open-source data visualization platform that works in conjunction with Elasticsearch to analyze large volumes of data. It is part of the Elastic Stack (formerly known as the ELK Stack), which consists of Elasticsearch, Logstash, and Kibana. Kibana provides an easy-to-use interface for interacting with the data stored in Elasticsearch indices and allows users to create custom dashboards, graphs, and reports.
Kibana enables users to explore data visually using interactive charts, graphs, and maps. It supports real-time data processing, enabling businesses to monitor systems and applications, perform log analysis, track performance metrics, and analyze large data sets in a meaningful way. Kibana is widely used in various industries for IT operations, security monitoring, business intelligence, and data analytics.
Top 10 Use Cases of Kibana
Kibana’s versatile capabilities make it applicable across a wide range of industries and use cases. Here are the top 10 ways businesses and organizations can use Kibana:
1. Log Analysis and Management
One of the most common uses of Kibana is for log management. Organizations can ingest log data into Elasticsearch and use Kibana to search, visualize, and analyze log data in real-time. This helps detect anomalies, troubleshoot issues, and monitor system health.
2. Monitoring and Operational Dashboards
Kibana is frequently used to create dashboards that display real-time metrics related to system performance, server health, and application uptime. IT teams use Kibana to monitor infrastructure components such as servers, networks, and cloud services.
3. Security Information and Event Management (SIEM)
Kibana is a powerful tool for security monitoring, especially when used as part of a SIEM system. Security teams use Kibana to analyze security logs, monitor network traffic, detect security incidents, and visualize attack patterns. Kibana helps organizations maintain proactive security postures and mitigate risks.
4. Business Intelligence and Analytics
Business analysts use Kibana to analyze large sets of business data, such as sales data, customer feedback, or operational performance. Kibana’s visualization capabilities help users create interactive reports and dashboards to uncover business trends and inform decision-making.
5. Application Performance Monitoring
With Kibana, developers can visualize and monitor application performance in real-time. By integrating with Elasticsearch, Kibana helps track metrics such as response time, error rates, throughput, and more, enabling businesses to optimize their applications and enhance user experiences.
6. Data Exploration and Ad-Hoc Queries
Kibana allows users to perform ad-hoc queries on the data stored in Elasticsearch. This is especially useful for data analysts who need to explore data on the fly, identify patterns, and draw insights without requiring complex SQL queries or database configurations.
7. Infrastructure Monitoring and Capacity Planning
Kibana is often used for infrastructure monitoring, helping IT teams track hardware and software resource utilization, network traffic, and system performance. Kibana helps businesses plan for capacity by providing insights into resource usage trends, enabling informed scaling decisions.
8. Customer Insights and Experience Analysis
By visualizing customer-related data such as behavior, transactions, and interactions, organizations can use Kibana to analyze customer journeys, preferences, and pain points. This enables businesses to improve customer experience and personalize marketing strategies.
9. IoT Data Visualization
With the rise of the Internet of Things (IoT), Kibana is used to visualize data generated by IoT devices, such as sensors, wearables, or smart devices. Kibana’s ability to handle large datasets allows businesses to monitor and visualize real-time IoT data, facilitating proactive management of IoT networks.
10. Fraud Detection and Risk Management
Financial institutions and e-commerce platforms use Kibana to detect fraudulent activities by analyzing transactional data, user behavior, and patterns. Kibana can visualize suspicious activities and alert security teams, helping reduce fraud and manage financial risks.
What Are the Features of Kibana?
Kibana is packed with features that make it a powerful data visualization tool. Some of its key features include:
- Interactive Dashboards: Create dynamic dashboards to visualize data with various types of charts, graphs, maps, and tables.
- Real-Time Data Processing: Kibana supports real-time data analysis, allowing you to view live data and monitor ongoing events.
- Custom Visualizations: Build custom visualizations using a wide range of chart types, such as pie charts, bar charts, line graphs, heat maps, and geographical maps.
- Search and Query Capabilities: Kibana offers advanced querying capabilities, including full-text search, filters, and aggregations, to explore and analyze data.
- Elastic Stack Integration: Kibana seamlessly integrates with Elasticsearch, Logstash, and Beats, enabling a comprehensive data analysis and monitoring solution.
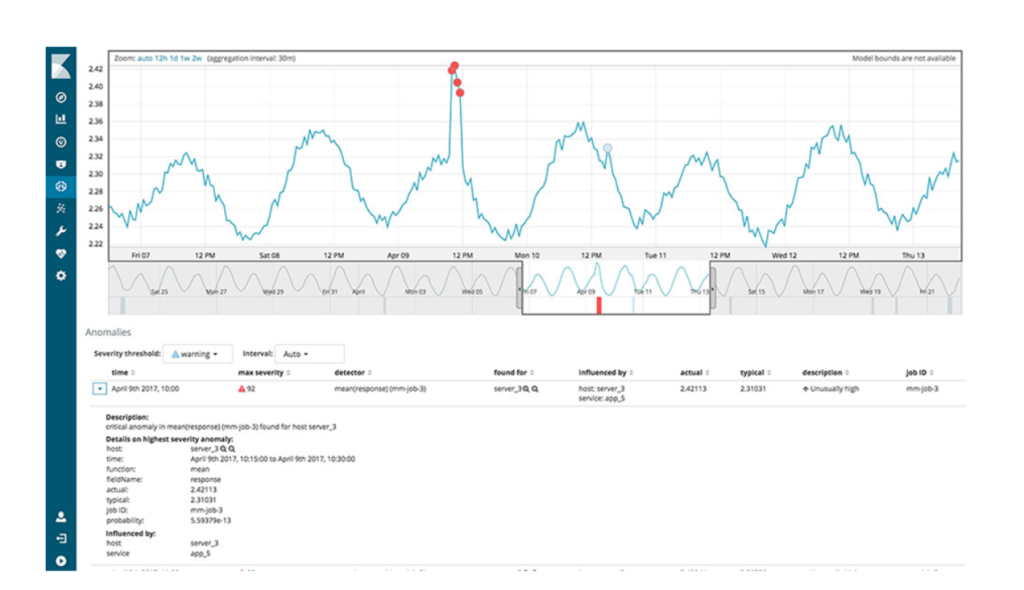
- Machine Learning: Kibana supports machine learning features for anomaly detection, forecasting, and trend analysis, helping organizations make predictive decisions.
- Alerting: Kibana includes alerting features that notify users of critical events, such as system failures, security breaches, or performance issues.
- Security and Access Control: Kibana allows for role-based access control, ensuring that sensitive data is accessible only to authorized users.
- Geospatial Analysis: Kibana’s support for geospatial data allows you to visualize geographic information, such as customer locations or sales territories, on interactive maps.
- Timelion: Kibana includes Timelion, a powerful time-series analysis tool that helps visualize time-based data trends and patterns.
How Kibana Works and Architecture

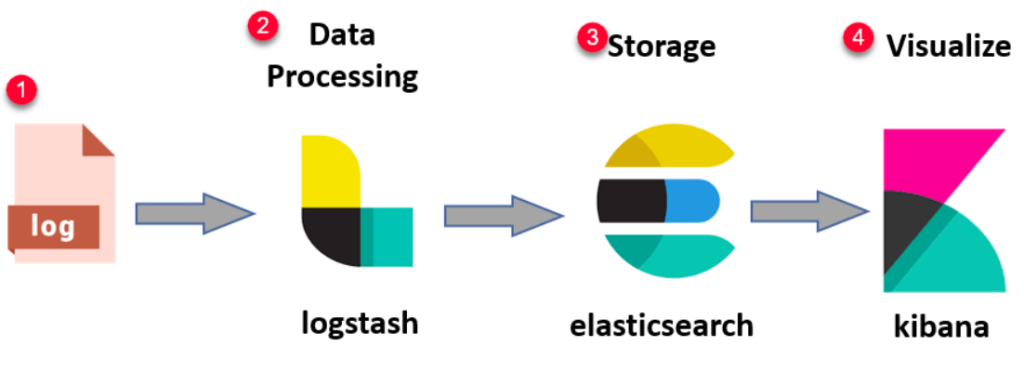
Kibana is part of the Elastic Stack and works in conjunction with Elasticsearch to provide data visualization and analysis capabilities. The architecture of Kibana can be broken down into the following components:
- Elasticsearch: At the core of Kibana is Elasticsearch, a distributed search and analytics engine that stores, indexes, and processes large volumes of data. Kibana interacts with Elasticsearch to query and visualize the data stored in its indexes.
- Kibana Interface: The Kibana user interface (UI) is web-based, allowing users to interact with Elasticsearch data through visualizations and dashboards. Users can create charts, graphs, and reports by querying data stored in Elasticsearch.
- Logstash and Beats: Data collected by Logstash (a data processing pipeline) and Beats (lightweight data shippers) is sent to Elasticsearch, where it can be indexed and processed. Kibana then retrieves and visualizes this data.
- Plugins: Kibana supports plugins that can extend its functionality. Popular plugins include those for machine learning, alerting, security, and reporting.
- Data Exploration: Kibana allows users to explore data interactively by drilling down into individual data points, using filters, and aggregating data into various formats.
How to Install Kibana?
Installing Kibana is straightforward and can be done on a local machine, server, or cloud platform. Here’s how you can install Kibana:
- Download Kibana:
- Go to the Kibana download page and select the version of Kibana compatible with your system (Windows, macOS, or Linux).
- Install Elasticsearch:
- Kibana requires Elasticsearch to work, so you will need to have Elasticsearch installed and running. You can download Elasticsearch from the Elastic website.
- Install Kibana:
- For Linux systems, use the package manager (e.g., APT, YUM) to install Kibana.
- For Windows or macOS, you can run the installer directly from the Kibana download page.
- Start Kibana:
- Once installed, start Kibana by running the following command in the terminal:
./bin/kibana - Kibana will start a local server (usually on port 5601). Access the Kibana UI by visiting
http://localhost:5601in your web browser.
- Once installed, start Kibana by running the following command in the terminal:
- Configure Kibana:
- After launching Kibana, you may need to configure it to connect to your Elasticsearch instance by editing the
kibana.ymlconfiguration file.
- After launching Kibana, you may need to configure it to connect to your Elasticsearch instance by editing the
Basic Tutorials of Kibana: Getting Started
Here are some basic steps to help you get started with Kibana:
1. Creating Your First Visualization:
- Log into Kibana and go to the Visualize tab.
- Select the type of visualization you want to create (e.g., bar chart, pie chart).
- Choose an Elasticsearch index pattern and configure the data source (fields) for your visualization.
- Customize the visualization to suit your needs and save it.
2. Building a Dashboard:
- After creating visualizations, go to the Dashboard section.
- Click “Create new dashboard” and add your saved visualizations to it.
- Arrange the visualizations as desired and save the dashboard.
3. Filtering Data:
- Use the filter bar at the top of the Kibana interface to filter data based on specific fields (e.g., dates, values, or categories).
- Apply multiple filters to refine your visualizations and dashboards.
4. Setting Up Alerts:
- In the Alerting section, create alert conditions based on thresholds for your data (e.g., when a metric exceeds a certain value).
- Configure notification channels to receive alerts via email, Slack, or other methods.
The Power of Kibana for Data Visualization
Kibana is an incredibly powerful tool for visualizing and analyzing data stored in Elasticsearch. Whether you’re monitoring system logs, analyzing business performance, or tracking security events, Kibana provides the tools you need to create meaningful visualizations and gain insights into your data. With its user-friendly interface, real-time processing capabilities, and flexible architecture, Kibana is an essential tool for any data-driven organization.
From IT operations to business intelligence and security monitoring, Kibana’s versatility allows users across various industries to leverage data visualization for better decision-making and performance optimization.