QlikView is a powerful business intelligence (BI) and data visualization tool designed to help organizations make data-driven decisions by transforming raw data into insightful, interactive dashboards and reports. It uses an associative data model, which allows users to explore data freely by navigating through different relationships and identifying patterns. QlikView provides advanced analytics capabilities such as real-time data updates, data compression, and in-memory processing, enabling fast and efficient analysis. It also supports interactive features like drag-and-drop reporting, making it user-friendly for non-technical users.
Use cases of QlikView span various industries and business functions. In finance, it is used for financial reporting, budgeting, and forecasting, helping companies track financial performance. In sales and marketing, QlikView is used to analyze customer behavior, sales trends, and market opportunities. Healthcare organizations leverage QlikView for patient data analysis, operational optimization, and tracking key health metrics. In supply chain management, it helps monitor inventory levels, supplier performance, and logistics operations. Additionally, it is commonly used in retail for tracking inventory, sales performance, and customer insights, ultimately improving decision-making and operational efficiency.
What is QlikView?
QlikView is a self-service BI tool developed by Qlik, designed for interactive data visualization and discovery. It enables users to consolidate data from multiple sources, create dashboards, and generate reports that help in data-driven decision-making. Unlike traditional BI tools that rely on predefined queries, QlikView allows users to freely explore data without being restricted by hierarchical structures.
Key Characteristics of QlikView:
- Associative Data Model: QlikView automatically links related data, enabling users to explore information intuitively.
- In-Memory Processing: Ensures fast data retrieval and analysis without the need for constant database queries.
- Self-Service BI: Enables business users to create reports and dashboards without extensive technical knowledge.
- Data Integration: Connects to multiple data sources, including databases, cloud applications, spreadsheets, and APIs.
- Advanced Data Visualization: Offers interactive dashboards with a variety of charts, graphs, and reports.
Top 10 Use Cases of QlikView
- Sales Performance Analysis
- Helps organizations track sales performance, monitor revenue trends, and forecast future sales.
- Customer Insights and Segmentation
- Analyzes customer demographics, behavior, and buying patterns to optimize marketing strategies.
- Financial Reporting
- Automates financial reporting, including profit and loss statements, cash flow analysis, and budgeting.
- Supply Chain Optimization
- Improves inventory management, supplier performance, and logistics efficiency.
- Retail Analytics
- Helps retailers track product sales, optimize pricing strategies, and monitor store performance.
- Marketing Campaign Performance
- Provides insights into campaign effectiveness, audience segmentation, and return on investment (ROI).
- Healthcare Data Analysis
- Enables hospitals and healthcare providers to analyze patient records, optimize resource allocation, and improve treatment plans.
- Human Resources (HR) Analytics
- Helps HR departments track employee performance, hiring trends, and workforce planning.
- IT and Operational Analytics
- Assists IT teams in monitoring system performance, troubleshooting issues, and improving service delivery.
- Education and Academic Analytics
- Enables educational institutions to analyze student performance, enrollment trends, and faculty productivity.
Features of QlikView
- Associative Data Model – Allows users to explore data relationships dynamically without predefined queries.
- Data Discovery – Empowers users to uncover hidden insights by freely navigating data points.
- Interactive Dashboards – Provides rich visualization options, including charts, graphs, and maps.
- In-Memory Processing – Ensures fast data analysis and visualization for large datasets.
- Data Connectivity – Connects with databases, cloud services, and APIs for seamless data integration.
- Collaboration and Sharing – Enables teams to share dashboards and reports across the organization.
- Advanced Security – Implements role-based access control and data encryption.
- Mobile Access – Allows users to access dashboards on tablets and smartphones.
- Automated Reporting – Supports scheduled data refreshes and report generation.
- Scalability – Handles large datasets efficiently, making it suitable for enterprises.

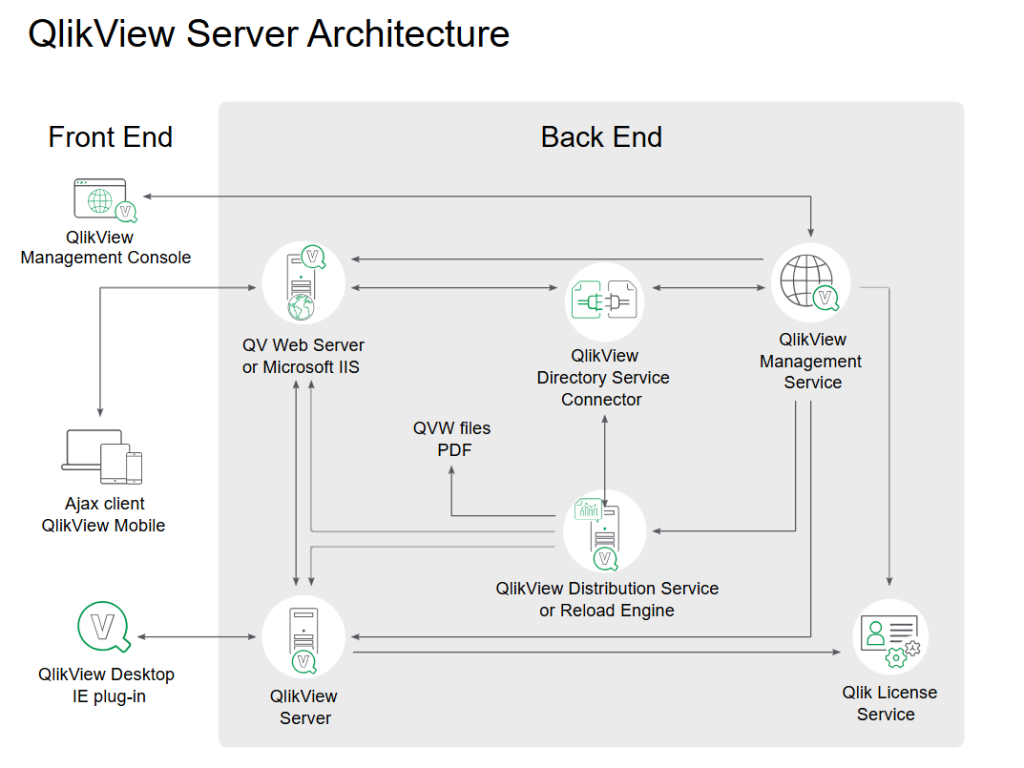
How QlikView Works and Architecture
1. Data Extraction & Loading
QlikView extracts data from multiple sources such as relational databases, Excel, cloud platforms, and web services.
2. Data Processing & Transformation
The extracted data is processed in memory using QlikView’s associative engine, allowing for quick transformations and calculations.
3. Data Modeling
Users create relationships between datasets without the need for complex joins or scripting.
4. Data Visualization & Analysis
Users design interactive dashboards and reports to analyze data visually.
5. Data Sharing & Collaboration
Dashboards and insights can be shared across teams for collaborative decision-making.
6. Deployment Options
QlikView supports on-premises, cloud, and hybrid deployments, offering flexibility based on business needs.
How to Install QlikView?
QlikView is a business intelligence (BI) and data visualization tool that is primarily used with a graphical user interface (GUI) for building reports and dashboards. It does not provide a “code-based” installation process like some other programming tools, but the installation of QlikView can be done programmatically using Windows automation tools or via command-line for enterprise environments.
Steps to Install QlikView
Here are the standard steps for installing QlikView on a Windows system. If you’re looking to automate this installation, I’ll provide a script example at the end.
1. Download QlikView Installer
- Go to the QlikView Download Page and download the QlikView Desktop installer.
- You may need to create a Qlik account to access the download.
2. Manual Installation (GUI-based)
Once you have the installer, follow these steps to install QlikView manually:
- Run the QlikView installer (e.g.,
QlikViewDesktop_x64.exe). - Follow the installation wizard to complete the installation. You will need to accept the license agreement and select the destination folder.
- After the installation is completed, launch QlikView from the Start menu.
3. Automated Installation via Command-Line (for Enterprise Use)
To automate the installation, you can use command-line options that QlikView provides for unattended or silent installations. You can run the installer in silent mode with specific flags to avoid GUI prompts.
Command-Line Installation Example:
For a silent installation, you can use a PowerShell script or command prompt to execute the installer in silent mode.
- Open a Command Prompt or PowerShell window as an Administrator.
- Run the following command:
QlikViewDesktop_x64.exe /quiet /install
This will install QlikView in silent mode without user intervention.
4. Automate Installation with PowerShell Script (For Batch or Multiple Systems)
Here’s how you can automate the QlikView installation using a PowerShell script:
# PowerShell Script to Install QlikView Silently

$installerPath = "C:\Path\To\QlikViewDesktop_x64.exe" # Provide the correct path to your QlikView installer

# Execute the silent installation
Start-Process -FilePath $installerPath -ArgumentList "/quiet /install" -Wait

Write-Host "QlikView Installation Completed"
This script automates the installation process by calling the QlikView installer with the /quiet and /install flags to ensure that the installation is done silently.
5. Verify Installation
Once the installation is complete, you can verify that QlikView is installed correctly by checking the following:
- QlikView Desktop should appear in your list of programs.
- You can also automate the verification by checking if the QlikView executable (
QlikView.exe) is located in the installation directory, which is typically located in:
C:\Program Files\Qlik\QlikView\QlikView.exeBasic Tutorials of QlikView: Getting Started
Step 1: Launch QlikView
Open QlikView and create a new document.
Step 2: Load Data
Import data from Excel, SQL databases, or cloud services.
File > Script Editor > Load Data
Step 3: Create a Visualization
Use drag-and-drop tools to design charts and graphs.
Layout > Add Chart > Customize Properties
Step 4: Explore Data
Use the associative model to filter and explore data dynamically.
Step 5: Save and Share
Save your dashboard and share it with team members for collaboration.