Source: physicsworld.com
Single-photon emission computed tomography (SPECT) is a diagnostic technique that detects gamma rays emitted by an injected radiotracer to create 3D images of tracer distribution in a patient. It is employed in a range of clinical applications, such as myocardial perfusion SPECT, for example, used to evaluate the heart’s blood supply. To perform quantitative image analysis, however, attenuation correction is essential.
This attenuation correction is usually performed using CT. But while many newer SPECT systems are equipped with a CT scanner, stand-alone SPECT still makes up around 80% of the market. To enable quantitative imaging on these SPECT-only scanners, researchers at Yale University have used deep learning methods to estimate attenuation maps directly from SPECT emission data (Eur. J. Nucl. Med. Mol. Imaging 10.1007/s00259-020-04746-6).
“Current SPECT-only systems without CT normally do not support transmission scanning and therefore are susceptible to attenuation artefacts,” explains first author Luyao Shi. “Being able to estimate attenuation maps from SPECT emission data is expected to increase the diagnostic accuracy for those scanners.”
Map generation
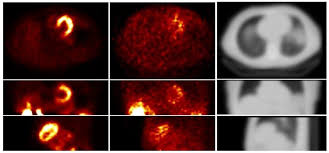
The researchers employed a generative adversarial network (GAN) machine learning framework to train two neural networks: a generator (U-net) that produces synthetic attenuation maps directly from the SPECT emission data; and a discriminator, which discriminates between the synthetic and CT-based maps. As both photopeak and scatter photons contain useful attenuation information, they used emission data from both the photopeak window (126–155 keV) and the scatter window (114–126 keV) as inputs into these neural networks.
The study included 65 subjects, with both normal and abnormal cardiac function, who underwent myocardial perfusion SPECT with the tracer 99mTc-tetrofosmin. All patients were scanned on a SPECT/CT scanner, with CT data acquired immediately after the SPECT scans and converted to attenuation maps. The team used scans from 40 subjects for training and 25 for testing.
A key pre-processing step for deep-learning algorithms is image normalization. For this study, Shi and colleagues employed mean normalization, in which each channel of a SPECT image is normalized by the mean intensity of the entire two-channel image volume. Using this approach, they found that the generated synthetic attenuation maps were consistent with ground-truth CT-based attenuation maps. Among the 25 testing subjects, the globally normalized mean absolute error (NMAE) between the synthetic and CT-based maps was 3.60±0.85%.
The researchers compared the results when using both primary and scatter window inputs (GAN-PS), primary window inputs alone and scatter window inputs alone. They also repeated these comparisons with maps generated using only the U-net model, without the discriminator. For both GAN and U-net, using both primary and scatter inputs produced the closest results to the CT-based attenuation map. Use of only primary window data led to inaccurate body boundary recovery and artefacts, while only using scatter window data resulted in incorrect organ shape.
In routine clinical practice, however, scatter window data are not always acquired. The team note that, if only primary window data are used as input, the GAN model could still generate accurate attenuation maps, while the U-net model led to much larger bias.
“Because of the help of the discriminator, GAN can generate more realistic results, especially when there is limited information,” Shi explains. “We included U-net in our analysis as the baseline to compare with, to show the improvement brought by GAN when only primary window information is available.”
Image correction
The team then used the predicted maps for attenuation correction of reconstructed SPECT images from the 25 test subjects. Images corrected using the CT-based and synthetic attenuation maps were highly consistent, with a NMAE between the two of just 0.26±0.15%. Again, when both primary and scatter window data were used as inputs, both GAN and U-net generated accurate results. However, when only primary windows were used, GAN clearly outperformed U-net.
As the heart is the key organ in myocardial perfusion studies, the researchers performed local region-of-interest (ROI) evaluations on SPECT images corrected with synthetic attenuation maps, looking at the left ventricle myocardium and blood pool. For both GAN and U-net, using primary and scatter data, mean voxel values in these ROIs showed negligible difference from those corrected using CT-based attenuation maps.
These initial results demonstrate the feasibility of generating accurate attenuation maps from emission data for myocardial perfusion SPECT. Next, the team plans to investigate whether SPECT scans from patients at rest or under pharmacological or exercise stress differ, and whether separate networks are needed for each group.
“In this single-site study, we demonstrated the robustness of our method for a single scanner and 99mTc-tetrofosmin tracer. Further investigation on a wide range of imaging protocols, scanner models and tracers will likely enhance the clinical impact,” added corresponding author Chi Liu.
