1. About This Course and Certification
The Grafana Training and Certification program by AI Universe, in collaboration with DevOpsSchool.com, is designed to provide a deep understanding of Grafana, an open-source platform for monitoring, visualization, and observability. This course covers both foundational and advanced topics, preparing participants to effectively monitor their applications and infrastructure using Grafana’s rich dashboard capabilities. The certification validates your expertise in configuring, managing, and optimizing Grafana for real-world use cases, making you highly sought after in the IT operations, DevOps, and monitoring fields.
2. What is Grafana?
Grafana is an open-source data visualization and monitoring tool that enables users to query, visualize, and understand their metrics across multiple sources such as Prometheus, InfluxDB, Elasticsearch, and more. Grafana allows users to create interactive and flexible dashboards that give real-time insights into application performance, infrastructure health, and user activity. With its intuitive interface, Grafana has become the go-to tool for developers, system administrators, and IT professionals to gain a comprehensive view of system metrics, performance logs, and alerts.
3. Why Grafana is Important?
In today’s rapidly evolving IT landscape, monitoring is crucial for ensuring application reliability, availability, and performance. Grafana is important because:
- Cross-Data Source Integration: It supports a wide range of data sources, allowing IT teams to view data from different systems in one place.
- Real-Time Visualization: Grafana provides real-time insights into application performance, making it easier to troubleshoot issues and optimize performance.
- Custom Dashboards: The ability to create fully customizable dashboards ensures that users can track metrics relevant to their unique business goals.
- Alerting and Notification: Grafana’s built-in alerting system allows users to set thresholds and notifications for critical metrics, enabling quick responses to potential issues.
- Cost-Effective: As an open-source solution, Grafana is highly cost-effective and scalable, suitable for both small projects and large enterprises.
By learning Grafana, professionals can monitor and manage the health of applications and infrastructure in real-time, which is essential for minimizing downtime and maintaining business continuity.
4. Course Features
- Instructor-Led Training: Led by expert trainer Rajesh Kumar, a renowned figure in the DevOps and monitoring domain.
- Hands-On Practice: Engage in practical labs and exercises that simulate real-world use cases.
- Comprehensive Content: Covers both fundamental and advanced topics in Grafana, including dashboard creation, data source integration, and alerting.
- Flexible Learning: Online or in-person training options available with flexible schedules.
- Certification Preparation: Complete preparation for obtaining a Grafana certification upon course completion.
- Access to Course Material: Lifetime access to training materials, session recordings, and supplementary resources.
5. Training Objectives
The course is structured to:
- Teach participants how to install and configure Grafana for various use cases.
- Provide comprehensive knowledge of data source integration, dashboard creation, and metrics visualization.
- Equip participants with the ability to set up alerts and notifications for critical system metrics.
- Enable participants to optimize performance monitoring for complex environments like cloud infrastructure, containers, and microservices.
- Prepare participants for the Grafana certification exam to validate their expertise.
6. Target Audience
This course is designed for:
- IT Operations Professionals responsible for monitoring and managing system infrastructure.
- DevOps Engineers who want to integrate performance monitoring into CI/CD pipelines.
- Developers and Application Engineers aiming to track application performance metrics in real-time.
- System Administrators looking to gain expertise in configuring and managing Grafana for server and network monitoring.
- Cloud Engineers who work in cloud-native and multi-cloud environments requiring comprehensive observability.
7. Training Methodology
The course is delivered through a mix of:
- Instructor-Led Lectures: Comprehensive presentations on Grafana’s core functionalities.
- Hands-On Labs: Practical exercises where participants will install and configure Grafana, integrate data sources, and build dashboards.
- Interactive Workshops: Scenario-based exercises to solve real-world monitoring challenges.
- Q&A Sessions: Dedicated time for participants to ask questions and receive personalized guidance from the instructor.
Participants will leave the course with the practical skills to implement Grafana in their own environments.
8. Training Materials
Participants will receive:
- Detailed Slide Decks: Covering all the key topics and concepts discussed during the course.
- Lab Exercises: Step-by-step instructions for practical tasks, including data source integration, dashboard creation, and alerting setup.
- Course Handouts: Reference material on Grafana best practices and advanced use cases.
- Video Recordings: Access to recorded training sessions for future reference.
- Certification Preparation Guide: A guide with practice questions and tips for passing the certification exam.
9. Evaluation
The course will be evaluated through:
- Pre-Test and Post-Test: Assess the participant’s knowledge before and after the course to measure progress.
- Hands-On Lab Evaluations: Assess participant performance based on lab exercises.
- Quizzes: Short quizzes at the end of each module to reinforce learning.
- Feedback Forms: Collect feedback from participants to improve the course.
- Certification Exam: After completing the course, participants will take the certification exam to validate their expertise in Grafana.
10. Continuing Education
After completing the course, participants can continue learning through:
- Advanced Grafana Workshops: Offered by AI Universe and DevOpsSchool.com.
- Grafana Community: Join the active Grafana community to engage with peers, share experiences, and learn from experts.
- Professional Development Opportunities: Participate in industry events, webinars, and conferences focused on observability, monitoring, and performance optimization.
- Online Resources: Access to Grafana documentation, blogs, and tutorials for continuous learning.
11. Certifications Program
Upon completion of the training, participants can take the Grafana Certified Associate and Grafana Certified Professional exams. These certifications validate proficiency in setting up, configuring, and managing Grafana for real-world monitoring tasks.
- Grafana Certified Associate: For individuals who have a solid understanding of Grafana’s core features.
- Grafana Certified Professional: For experts who can implement Grafana at scale in complex environments.
12. Level of the Training
The course is designed for learners at all levels:
- Fundamental: Installation, configuration, and basic dashboard creation.
- Intermediate: Integrating multiple data sources, setting up advanced queries, and custom dashboards.
- Advanced: Cloud infrastructure monitoring, performance optimization, and configuring Grafana for enterprise environments.
13. Agenda (Day-wise for 5 Days)
Day 1: Introduction and Setup
- Introduction to Grafana and its architecture.
- Installing and setting up Grafana (local and cloud).
- Overview of the Grafana UI and navigation.
- Lab: Installing Grafana and configuring the first data source (e.g., Prometheus).
Day 2: Dashboard and Visualization Essentials
- Creating and managing dashboards in Grafana.
- Working with panels, queries, and visualizations.
- Lab: Building custom dashboards to monitor basic system metrics.
Day 3: Advanced Queries and Data Source Integration
- Integrating multiple data sources (Prometheus, Elasticsearch, InfluxDB, etc.).
- Writing advanced queries for data visualization.
- Lab: Connecting multiple data sources and creating multi-dimensional visualizations.
Day 4: Alerting and Notifications
- Setting up alerts in Grafana and configuring alert rules.
- Integrating Grafana with alerting tools like Slack, PagerDuty, and email.
- Lab: Configuring alerts and creating notification channels.
Day 5: Performance Optimization and Certification Preparation
- Monitoring complex systems (Kubernetes, Docker, cloud infrastructure).
- Optimizing dashboards for performance.
- Certification exam preparation and mock tests.
- Lab: Implementing real-world performance monitoring for cloud-native applications.
14. Lab Setup
For the hands-on labs, participants will need:
- System Requirements: 8GB RAM, 4 CPU cores.
- Virtual Machines: Linux/Windows VM for running Grafana.
- Access to Data Sources: Prometheus, InfluxDB, Elasticsearch, or other monitoring tools.
- Network Access: Internet connection to connect to external data sources and alerting tools.
- Cloud Access: (Optional) Access to cloud platforms (AWS, GCP, Azure) for cloud monitoring labs.
15. Trainers
The course is led by Rajesh Kumar, a seasoned expert in DevOps and performance monitoring with over 15 years of experience in the industry. Rajesh has conducted training sessions globally and is known for his practical and hands-on approach to teaching.
You can learn more about Rajesh Kumar at rajeshkumar.xyz.
16. FAQ
- What is Grafana used for? Grafana is a visualization and monitoring platform used to query, visualize, and analyze metrics from multiple data sources.
- Who is this course for? ThisHere’s the continuation of the FAQ section and completion of the comprehensive content for the Grafana Training Course and Certification Program page:
FAQ (Continued)
- Who is this course for? This course is designed for IT operations professionals, DevOps engineers, cloud engineers, and system administrators who are responsible for monitoring and managing system performance and infrastructure health.
- Do I need prior knowledge to join this course? Basic knowledge of monitoring tools, system administration, and performance metrics is recommended, but not mandatory. The course covers both fundamental and advanced topics.
- Is this course hands-on? Yes, the course includes extensive hands-on labs where participants will configure Grafana, integrate data sources, and build interactive dashboards.
- Will I receive a certificate after completing this course? Yes, participants who complete the course and pass the certification exam will receive Grafana Certified Associate or Grafana Certified Professional certification.
- What kind of projects will I work on during the training? You will work on real-world scenarios such as monitoring cloud applications, setting up dashboards for infrastructure monitoring, and creating alerts for performance thresholds.
- How long do I have access to the course materials? You will have lifetime access to the recorded sessions, course materials, and lab exercises for reference.
- Can I attend this course online? Yes, the course is available both online and in-person. You can choose the mode of learning that suits your schedule.
- Will there be support after the course is completed? Yes, participants will have access to a community forum, online resources, and continued guidance from the instructor for any follow-up questions or advanced topics.
- How is the certification exam conducted? The certification exam is conducted online, and it is designed to test both theoretical knowledge and practical experience with Grafana.
Certification
- Certification always plays vital role as it leads you towards a dedicated knowledge and skillsets.
- It provides you the ability to stand out of others.
- It gives you an edge during an interview by impressing the interviewer through your certification.
- DevOpsSchool helps you getting this certificate by making you worth to have it.
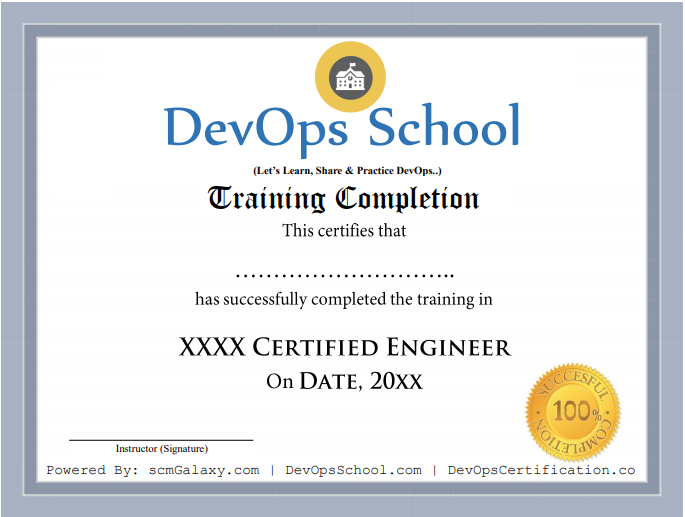
- DevOpsSchool gives you a completion certificate after successfully completion your training. it will be as a proof of your ability of knowledge and skills.
- The training will be given by industry recognized expert trainers who will make you an expert professional to hold this certificate.
- This certificate belongs to only DevOpsSchool, not to any other colleges, institute or company.
Reviews
By having an excellent journey with 8000+ participants from different countries we have got excellent reviews that helps us stand out of other institutes and being proud. We proudly can say we have helped so many individuals and working professionals to build their career. Here are some of the reviews that we have got from our participants who are happy by being a part of DevOpsSchool.
Videos
Projects
During this training you will get a real-time based project to work on, which will help you to implement your learnings and also it will boost your knowledge and skills. With important tools and platforms you will have real-world experience where we help you to visualize a real development environment, testing environment and production environments.
FAQs
1. Will I get technical support after completion of training?
- Yes, Its free of cost for life time. We will give you can access of our Google drive where you can drop you query and our trainers will respond you back.
2. Why should I learn Grafana course online instead of offline?
- First this is the best option to keep you and your instructor safe in this dangerous pendamic. As well as the environment and benefits what you will get in offline classes same we will provide you in online classes. We will make your experience much better and comfortable than offline classes. That’s why we provide live and instructor-led online classes where you can interact your instructor to clear your doubts.
3. How long will it take to complete the course?
- It will take approx 15 Hrs to fully complete the course.
4. Will I get any placements after the training?
- Well we don’t provide any placements as of now but we can provide you a interview kit to help you out.
5. What are the pre-requisies to learn Grafana?
- Elementary knowledge of Unix/Linux can help you.
- Basic knowledge about monitoring
6. Can a non technical person learn Grafana?
- Yes, but it will be very hard to learn because here the technical words and platforms will be used that he will be not aware of so in my recommendation you shouldn’t try but if still if you want to then yoou should be very concentrated and honest with you as you have to work hard.
7. Do you have online classes or offline classes?
- As of now online classes but he it is a group of people requirement then we can have discussion about offline classes.
8. Will I get the job after completing this course?
- Yes, you will be fully capable to perform any task given to you by your domain senior or manager. As you will be certified engineer who will have all the required skills and knowledge to perform any task.
9. Which kind of certification will DevOpsSchool provide?
- It’s a completion certificate. It will show that you have successfully completed the training and have the right skills and knowledge to perform the task assigned by your company.
10. How to start a Grafana career?
- You can go for self learning materials like Pdf, Slides, youtube videos but there are one more option that is our NewRelic program. It’s our NewRelic certifed program that will teach you from basic to make you able to understand and perform a NewRelic engineer tasks.
11. Who will be my trainer?
- As we have so many trainers its not possible to tell you quickly, as we have to go through their availability. But we can assure you you will get a best trainer as we have a group of best trainers who are very experienced and skillful trainers. They have 15+ iT working experience.
12. Can I get a demo session?
No we don’t provide any demo class but instead of that we can provide you a class recordings so you can decide.
13. Do we have classroom training?
Yes, Classroom training is available in Bangalore, Hyderabad, Chennai and Delhi location. Apart from these cities classroom session can be possible if the number of participants are 6 plus in that specific city.
14. How will I execute the Practicals?
All the Demo/Hands-on are to be executed by our trainers on DevOpsSchool’s AWS cloud. We will provide you the step-wise guide to set up the LAB which will be used for doing the hands-on exercises, assignments, etc. Participants can practice by setting up the instances in AWS FREE tier account or they can use Virtual Machines (VMs) for practicals.
15. What if I miss any class?
In case if you miss the class then there are two ways to get to know what topics has been covered, i.e 1st- We will share the class recordings, notes etc to you and 2nd – you can attend any other session under 3 months of time period.
Our Gallery

