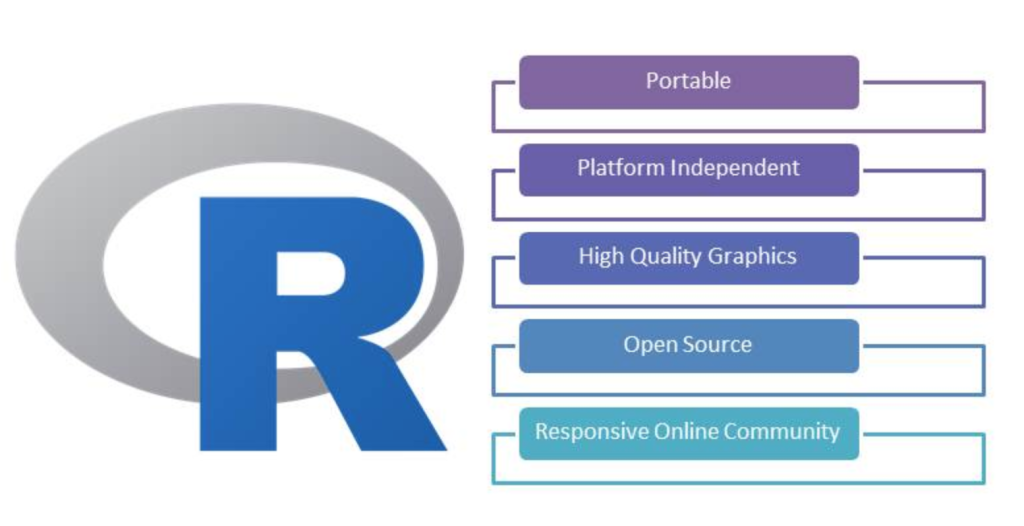
R is a powerful programming language and software environment for statistical computing and graphics. It was created by Ross Ihaka and Robert Gentleman at the University of Auckland, New Zealand, and is now maintained by the R Development Core Team. R provides a wide variety of statistical and graphical techniques, and is widely used by statisticians and data scientists for data analysis, data visualization, and predictive modeling.
Top Use Cases of R
- Data Analysis: R is commonly used for data analysis tasks such as data cleaning, data manipulation, and data visualization. Its extensive library of statistical functions and packages make it a popular choice for analyzing and interpreting data.

- Machine Learning: R has a rich ecosystem of packages for machine learning, including popular libraries like caret, random Forest, and glmnet. These packages provide implementations of various machine learning algorithms, making it easy to build predictive models and perform tasks like classification, regression, and clustering.

- Statistical Modeling: R is widely used for statistical modeling, including linear regression, logistic regression, time series analysis, and more. Its built-in functions and packages make it easy to fit models to data and perform statistical inference.

- Data Visualization: R provides powerful tools for creating visualizations, including bar plots, scatter plots, line plots, and more. Its ggplot2 package is particularly popular for creating publication-quality graphics.

Features of R
- Open Source: R is an open-source language, which means that it is freely available and can be modified and distributed by anyone. This has led to a large and active community of developers who contribute to the language and create new packages.
- Extensive Library: R has a vast library of packages and functions for various purposes, such as data manipulation, statistical analysis, machine learning, and more. These packages can be easily installed and loaded into R, providing additional functionality and making it easy to perform complex tasks.
- Reproducibility: R promotes reproducible research by providing tools for documenting and sharing code and results. This allows others to easily reproduce and verify your analysis, increasing transparency and trust in the research process.
Workflow of R

The workflow of R typically involves several steps:
- Data Import: The first step is to import your data into R. This can be done using functions like read.csv() or read.table() for reading data from files, or using packages like dplyr or tidyr for importing data from databases or other sources.
- Data Cleaning and Manipulation: Once the data is imported, you may need to clean and manipulate it to prepare it for analysis. R provides a wide range of functions and packages for performing tasks like removing missing values, transforming variables, and creating new variables.
- Data Analysis: After the data is cleaned and prepared, you can perform various statistical analyses using R’s built-in functions or packages. This may involve fitting models, performing hypothesis tests, or calculating summary statistics.
- Data Visualization: R provides powerful tools for creating visualizations to explore and communicate your data. This can be done using functions like plot() or with packages like ggplot2, which allows for more advanced and customizable graphics.
- Reporting and Sharing: Finally, you can generate reports or presentations of your analysis using R Markdown or other tools. This allows you to combine code, text, and visualizations in a single document, making it easy to share your work with others.
How R Works & Architecture

R is an interpreted language, which means that code is executed line by line without the need for compilation. When you run an R script or command, the R interpreter reads the code, evaluates it, and produces the desired output.
The architecture of R consists of several components:
- R Console: This is the interface where you interact with R. You can type commands directly into the console and see the results immediately.
- R Scripts: R scripts are files that contain a series of R commands. They can be saved and executed as a batch, making it easy to automate repetitive tasks or perform complex analyses.
- R Packages: R packages are collections of functions, data, and documentation that extend the functionality of R. They can be installed and loaded into R using the install.packages() and library() functions, respectively.
- R Environment: The R environment is where objects like data, functions, and variables are stored during an R session. You can create, modify, and manipulate these objects to perform your analysis.
How to Install and Configure R
To install R, you can visit the official R website (https://www.r-project.org/) and download the appropriate version for your operating system. Once downloaded, you can follow the installation instructions provided on the website.
After installing R, you may also want to install an integrated development environment (IDE) for a better coding experience. Some popular IDEs for R include RStudio, Visual Studio Code, and Jupyter Notebook.
Once you have R and an IDE installed, you can start writing and executing R code.
Step by Step Tutorials for R – Hello World Program
To get started with R, you can follow these step-by-step tutorials to write a simple “Hello World” program:
- Open your preferred IDE and create a new R script.
- In the script, type the following code:
# Print "Hello, World!" to the console
print("Hello, World!")
- Save the script with a .R file extension, such as hello_world.R.
- Run the script by clicking the “Run” or “Execute” button in your IDE. The output “Hello, World!” should be displayed in the console.
Congratulations! You have successfully written and executed your first R program.
Remember, learning R is a journey, and there is always more to explore and discover. Have fun exploring the world of statistical computing and data analysis with R!