Source – https://searchapparchitecture.techtarget.com/
We examine how monitoring and observability help development teams keep a distributed architecture from coming unraveled by individual failures and performance bottlenecks.
Failure is rarely predictable, and detecting the exact cause of complex application errors post-deployment is excruciatingly difficult. Even the most experienced development teams struggle to prepare for all the possible scenarios that could bring down their applications and put data at risk.
For this reason, the ability to detect problems in real time and address them quickly is essential. This is where observability and monitoring come into play, and architects who approach these two tasks diligently will reap the rewards of a more resilient software architecture. Let’s explore more about the specifics of observability and monitoring, including how they differ and the fundamental practices that each one dictates.
What is observability?
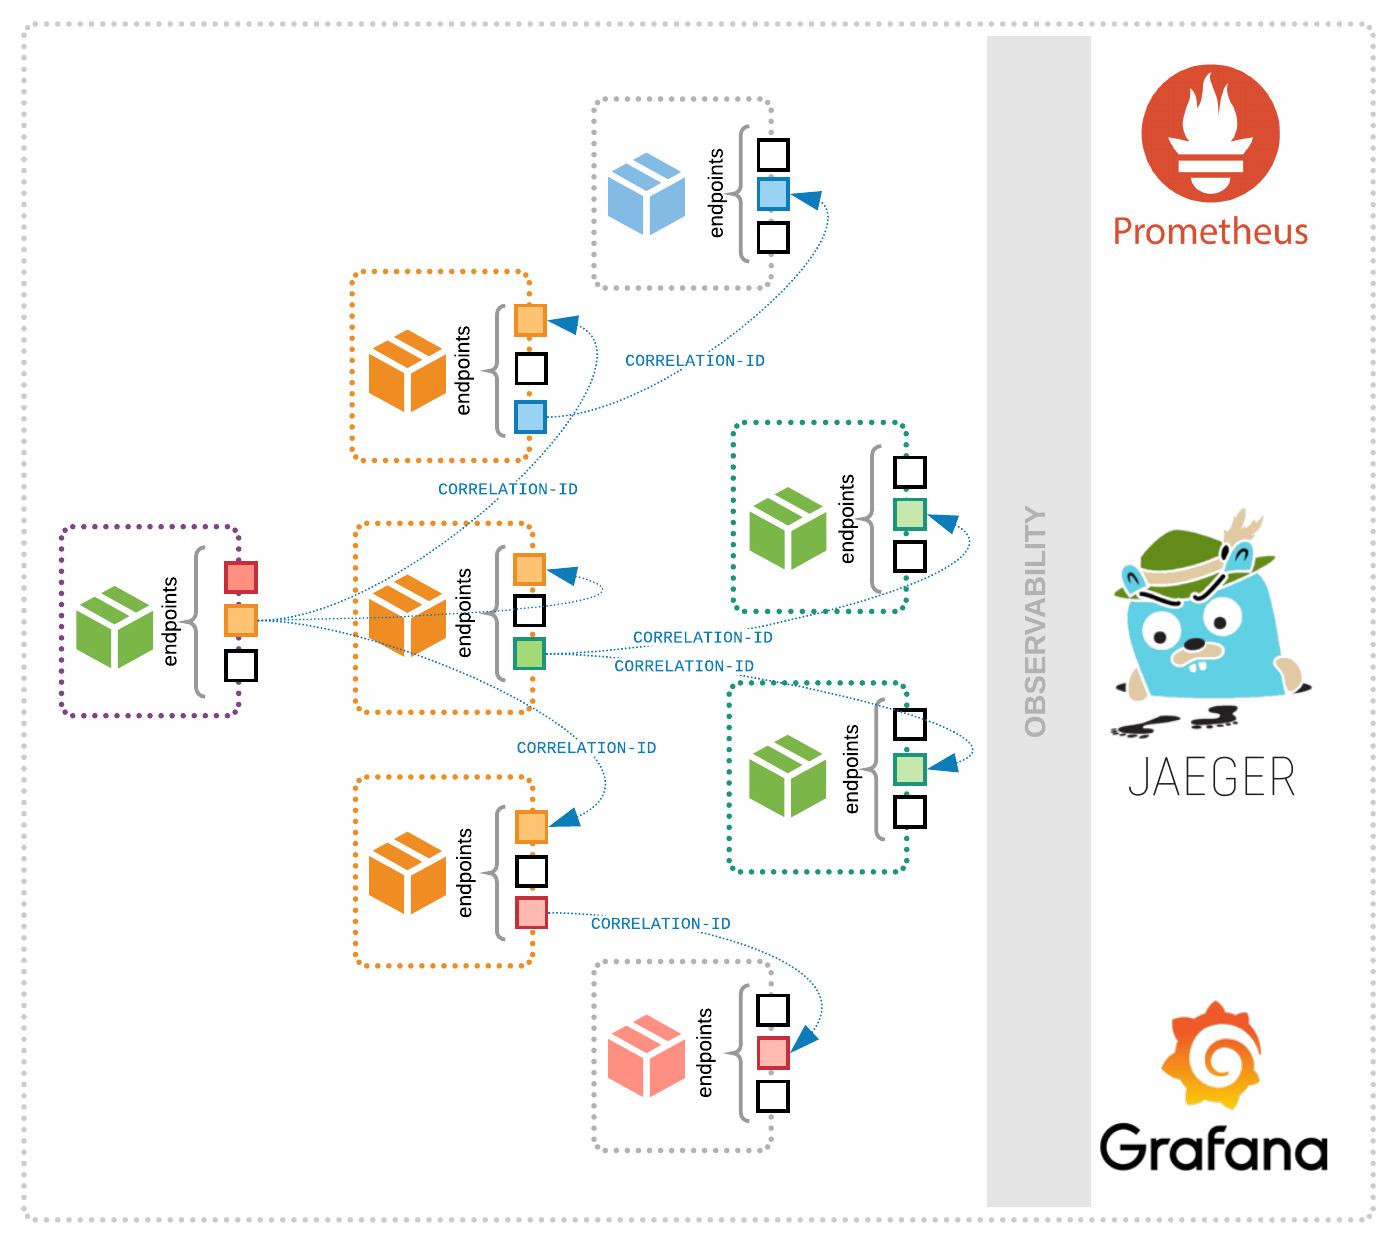
Observability in microservices largely revolves around making sure development teams have access to the data they need to identify problems and detect failures. For example, an observable system can help developers understand why a specific service call failed, or determine the source of bottlenecks in a particular application workflow.
With the surge in microservices adoption, it is imperative that a system is observable for effective debugging and diagnostics. Since services can span across multiple systems and run operations independently, tracing the source of a failure is a grueling and time-consuming task — if even possible.
Observability consists of three fundamental components:
- Logs are timestamped records that provide comprehensive information about an application’s behavior as it executes functions and communications. These logs are particularly useful when things go wrong in a microservices architecture, because architects can use this information to better identify specific defects and debug code.
- Metrics are numeric records of an application’s resource use, performance and stability. For example, metrics will show the number of requests a service can handle per second, or the total amount of resources an activity consumes.
- Traces keep track of IDs, names and other values and help architects monitor application transactions that cross multiple systems. This makes tracing particularly useful for microservices-based, serverless and containerized applications that rely on multitudes of integrations and asynchronous communication.
What is monitoring?
Monitoring is a process that tracks performance and identifies problems and anomalies. Overall, it describes the health, performance, efficiency and other essential features relative to the internal state.
Much like observability, monitoring can help detect and identify failures, but it does so with a focus on qualitative information. For example, you might want to monitor an application for issues such as excessive data consumption, service messaging failures or breaking changes. To use monitoring effectively, architects must determine core sets of metrics that provide a benchmark for the overall health of the system, such as acceptable latency times and call failure rates.
When monitoring microservices-based applications, architects must gain a comprehensive understanding of the various calls an application and its related services make. Don’t forget to monitor APIs and containerized services, and map monitoring processes and responsibilities based on team structure. Everyone should know who owns what service, and who needs to address a certain failure.
Microservices monitoring and observability tools
Some organizations try to adopt a manual, do-it-yourself approach to observability and monitoring by stringing homegrown monitoring solutions into their architecture. However, this takes up a lot of time, and is not likely to meet the needs of large, distributed systems.
Before attempting to do it yourself, you might want to look into existing tools designed to provide the essential aspects of monitoring and observability in microservices. Here are a few notable tools and platforms worth consideration.
Sentry
Sentry is an open source monitoring system designed with a focus on real-time, code-level error tracking that pinpoints failures and allows developers to address issues quickly. Part of Sentry’s appeal rests in its ability to analyze the scope of a failure, allowing developers to easily prioritize errors based on severity. It also features ready-made integrations with most popular development languages and frameworks, such as JavaScript, Python, Objective-C and iOS, as well as services like GitHub and Splunk.
Sensu
Sensu is another open source observability and monitoring tool that excels at monitoring applications, services, servers and containers deployed across large software ecosystems and cloud environments. Some of Sensu’s spotlight features include role-based service identification, its alignment with publish-subscribe messaging patterns and an interface that provides quick visuals of code workflows.
Sumo Logic
Thanks to this platform’s notable proficiency in data aggregation and analysis, Sumo Logic is a very useful tool for gleaning continuous metrics from application logs in real time and quickly spotting performance and stability issues in service workflows. Sumo Logic boasts a number of microservices-specific observability features, such as distributed tracing for services, transactions and application data.


