In the world of cloud computing, monitoring and observability are key to maintaining system reliability, performance, and cost-efficiency. Amazon CloudWatch, a service from Amazon Web Services (AWS), is a comprehensive monitoring and management tool designed to help organizations track system performance, detect issues, and optimize resource usage in real-time. This blog explores Amazon CloudWatch, its top use cases, features, architecture, installation process, and basic tutorials to help you get started.
What is Amazon CloudWatch?
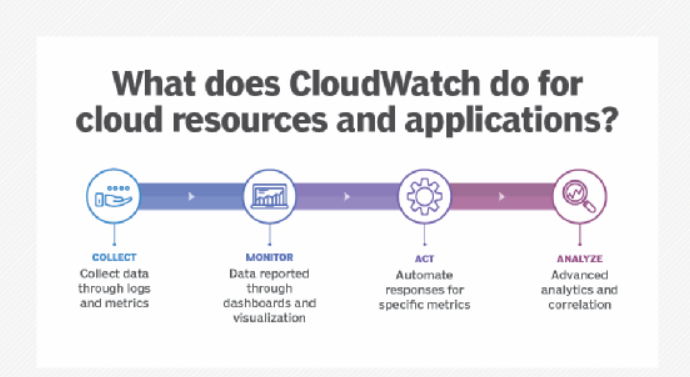
Amazon CloudWatch is a monitoring and observability service that provides insights into AWS resources, applications, and on-premises systems. It collects and visualizes data from various sources, including metrics, logs, and events, enabling organizations to monitor their infrastructure and applications in real-time. CloudWatch helps IT teams optimize performance, troubleshoot issues, and automate responses to system changes.
Key functionalities of Amazon CloudWatch:
- Real-time monitoring: Tracks metrics and logs for AWS services and custom applications.
- Actionable insights: Alerts and dashboards for operational visibility.
- Automation: Enables auto-scaling and remediation based on predefined rules.
CloudWatch is deeply integrated into the AWS ecosystem, making it a vital tool for anyone leveraging AWS for cloud infrastructure.
Top 10 Use Cases of Amazon CloudWatch
- Infrastructure Monitoring
Tracks the health and performance of AWS services such as EC2, RDS, S3, and Lambda to ensure system reliability. - Application Performance Monitoring (APM)
Monitors application performance metrics, including response times, request rates, and error rates, to optimize the user experience. - Log Analysis
Collects and analyzes logs from AWS resources and on-premises systems using CloudWatch Logs Insights. - Auto-Scaling Triggers
Automatically scales AWS resources up or down based on metrics such as CPU utilization or memory usage. - Custom Metrics Monitoring
Tracks custom application metrics, such as user activity or transaction counts, for business-specific insights. - Cost Optimization
Identifies underutilized resources and high-spending areas through resource usage metrics. - Event-Driven Automation
Responds to system events with predefined actions, such as restarting a failed instance or scaling up resources. - Compliance and Security Monitoring
Tracks security logs and compliance metrics using integrations with AWS services like AWS Config and GuardDuty. - Dashboard Creation
Builds centralized dashboards to visualize key metrics and logs for different teams. - Incident Detection and Alerting
Sets up alarms to detect anomalies or thresholds breaches, ensuring quick resolution of issues.
What Are the Features of Amazon CloudWatch?
- Metrics Collection
Captures and stores metrics for AWS services and custom applications. - Alarms and Alerts
Configures alarms to trigger notifications or automated actions when thresholds are breached. - Logs Management
Collects, stores, and analyzes logs using CloudWatch Logs Insights. - Dashboards
Provides customizable dashboards for real-time visualization of metrics and logs. - Event Monitoring
Tracks system changes and responds to events through CloudWatch Events. - Auto-Scaling Support
Enables dynamic scaling of resources based on monitored metrics. - Cross-Account Observability
Consolidates metrics and logs from multiple AWS accounts for centralized monitoring. - Anomaly Detection
Uses machine learning to detect unusual patterns in metrics automatically. - Integration with AWS Services
Seamlessly integrates with other AWS tools like Lambda, EC2 Auto Scaling, and Systems Manager. - Custom Metrics and Logs
Allows users to publish custom metrics and logs for specific application requirements.

How Amazon CloudWatch Works and Architecture
How It Works
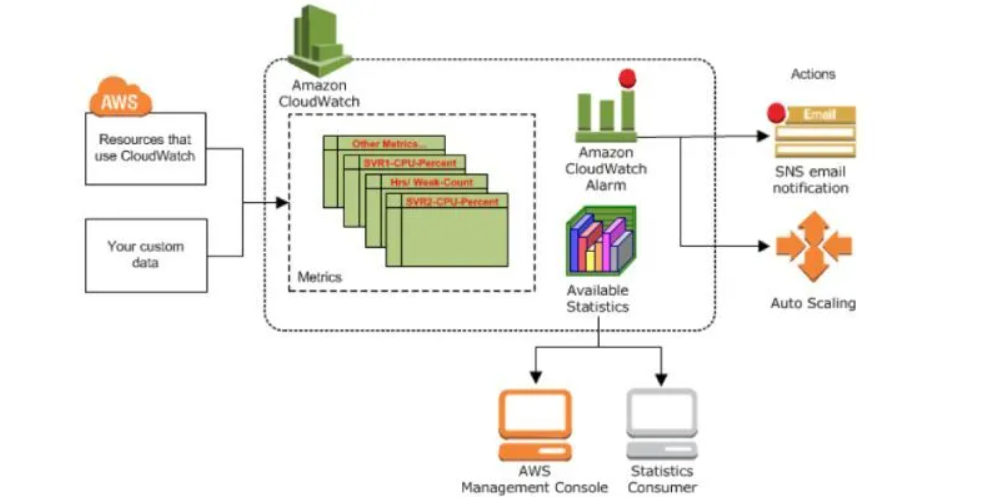
Amazon CloudWatch operates by collecting data from various AWS services, on-premises systems, and custom applications. It stores this data, analyzes it, and provides actionable insights through alarms, dashboards, and reports. CloudWatch also enables automated responses to specific triggers, helping organizations maintain operational efficiency.
Architecture Overview
- Data Sources:
- AWS Resources: EC2, RDS, Lambda, S3, etc.
- Custom Applications: Applications sending custom metrics and logs.
- On-Premises Systems: Integrated using CloudWatch Agent.
- Data Collection:
- Metrics: Real-time data points like CPU usage or request count.
- Logs: Event logs from applications and systems.
- Data Processing and Storage:
- Metrics are stored in a time-series database.
- Logs are stored in CloudWatch Logs for analysis.
- Analytics and Insights:
- Uses CloudWatch Logs Insights and dashboards for data visualization and querying.
- Actionable Responses:
- Alarms trigger notifications or execute AWS Lambda functions for automated remediation.
How to Install Amazon CloudWatch
1. Prerequisites
- An active AWS account.
- AWS CLI is installed and configured on your system.
2. Enable CloudWatch for AWS Resources
- AWS services like EC2 and RDS automatically send metrics to CloudWatch when launched.
3. Install CloudWatch Agent for Custom Metrics and Logs
- Step 1: Download and install the CloudWatch Agent on your server.
sudo yum install amazon-cloudwatch-agent- Step 2: Configure the agent using the
amazon-cloudwatch-agent-config-wizardcommand. - Step 3: Start the agent:
sudo /opt/aws/amazon-cloudwatch-agent/bin/amazon-cloudwatch-agent-ctl \ -a start -m ec2 -c file:/opt/aws/amazon-cloudwatch-agent/bin/config.json4. Set Up Alarms and Dashboards
- Navigate to CloudWatch in the AWS Management Console.
- Create alarms for specific metrics and set up notification actions.
- Build dashboards for real-time visualization of metrics.
Basic Tutorials of Amazon CloudWatch: Getting Started
1. Viewing Metrics in CloudWatch
- Go to the CloudWatch Console > Metrics.
- Select a namespace (e.g., EC2, Lambda) and view the available metrics.
2. Creating an Alarm
- Navigate to CloudWatch Console > Alarms > Create Alarm.
- Choose a metric (e.g., CPU Utilization) and define the threshold.
- Set up a notification using an SNS topic.
3. Analyzing Logs
- Open CloudWatch Logs in the console.
- Select a log group and run a query using CloudWatch Logs Insights.
fields @timestamp, @message
| sort @timestamp desc
4. Setting Up a Custom Dashboard
- In the CloudWatch Console, click Dashboards > Create Dashboard.
- Add widgets to display metrics and logs in real time.
5. Publishing Custom Metrics
- Use the AWS CLI to publish custom metrics:
aws cloudwatch put-metric-data --metric-name PageLoadTime \
--namespace MyApp --unit Milliseconds --value 123
6. Configuring Auto-Scaling
- Link CloudWatch alarms to EC2 Auto Scaling groups for dynamic scaling based on workload metrics.
7. Integrating with Lambda
- Set up CloudWatch Events to trigger AWS Lambda functions for automated responses.