Source – https://aithority.com/
What Is Data Science?
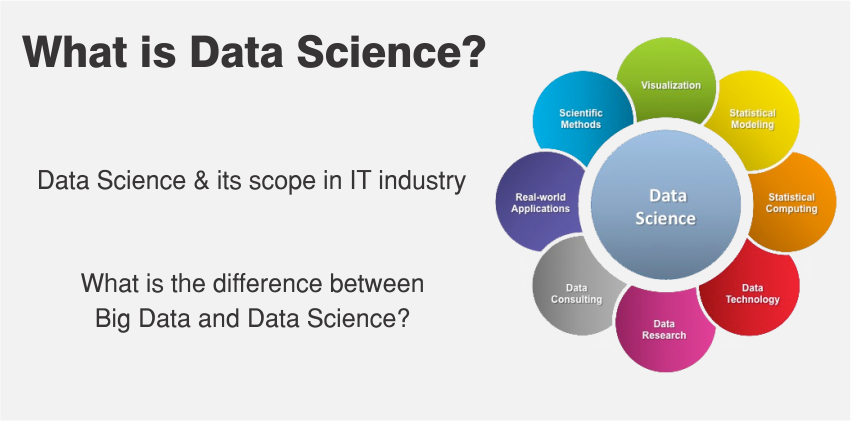
The terminology came into the picture when the amount of data had started expanding in the starting years of the 21st century. As the data increased, there was a newly emerged need to select only the data that is required for a specific task. The primary function of data science is to extract knowledge and insights from all kinds of data. While data mining is a task that involves finding patterns and relations in large data sets, data science is a broader concept of finding, analyzing, and providing insights as an outcome.
In short, data science is the parent category of computational studies, dealing with machine learning, and big data.
Data science is closely related to Statistics. But as opposed to statistics, it goes way beyond the concepts of mathematics. Statistics is the collection, interpretation of quantitative data where there is accountability for assumptions ( like any other pure science field). Data science is an applied branch of statistics dealing with huge databases which require a background in computer science. And, because they are dealing with such an incomprehensible amount of data, there is no need to consider assumptions. In-depth knowledge of mathematics, programming languages, ML, graphic designing, and the domain of the business is essential to become a successful data scientist.
How Does It Work?
Several practical applications provide personalized solutions for business problems. The goals and working of data science depend on the requirements of a business. The companies expect prediction from the extracted data; to predict or estimate a value based on the inputs. Via prediction graphs and forecasting, companies can retrieve actionable insights. There’s also a need for classifying the data, especially to recognize whether or not the given data is spam. Classification helps in work reduction in further cases. A similar algorithm is to detect patterns and group them so that the searching process becomes more convenient.
Commonly Used Techniques In The Market
Data Science is a vast field; it is very difficult to name uses of all the types and algorithms used by data scientists today. Those techniques are generally categorized according to their functions as follows:
Classification – The act of putting data into classes on both structured and unstructured data (unstructured data is not easy to process, at times distorted, and requires more storage).
Further in this category, there are 7 commonly followed algorithms arranged in ascending order of efficiency. Each one has its pros and cons, so you have to use it according to your need.
Logistic Regression is based on binary probability, most suitable for a larger sample. The bigger the size of the data, the better it functions. Even though it is a type of regression, it is used as a classifier.
The Naïve Bayes algorithm works best on a small amount of data and relatively easy work such as document classification and spam filtering. Many don’t use it for bigger data because the algorithm turns out to be a bad estimator.
Stochastic Gradient Descent is the algorithm that keeps updating itself after every change or addition for minimal error, in simple words. But a huge problem is that the gradient changes drastically even with a small input.
K-Nearest Neighbours is typically common to deal with large data and acts as the first step before further acting on the unstructured data. It does not generate a separate model for classification, just shows the data nearest to the K. The main work here lies in determining the K so that you get the best graph of the data.
The Decision Tree provides simple visualized data but can be very unstable as the whole tree can change with a small variation. After giving attributes and classes, it provides a sequence of rules for classifying the data.
Random forest is the most used technique for classification. It is a step ahead of the decision tree, by applying the concept of the latter to various subsets within the data. Owing to its complicated algorithm, the real-time analysis gets slower and is difficult to implement.
Support Vector Machine(SVM) is the representation of training data in space, separated with as much space as possible. It’s very effective in high dimensional spaces, and very memory efficient. But for the direct probability estimations, companies have to use an expensive five-fold cross-validation.
Feature Selection – Finding the best set of features to build a model
Filtering defines the properties of a feature via univariate statistics, which proves to be cheaper in high-dimensional data. Chi-square test, fisher score, and correlation coefficient are some of the algorithms of this technique.
Wrapper methods search all the space for all possible subsets of features against the criterion you introduce. It is more effective than filtering but costs a lot more
Embedding maintains a cost-effective computation by using a mix of filtering and wrapping. It identifies the features that contribute the most to a dataset.
The hybrid method uses any of the above alternatively in an algorithm. This assures minimum cost and the least number of errors possible.
