In today’s fast-paced digital landscape, businesses rely on complex cloud environments, microservices, and distributed applications. Monitoring, analyzing, and optimizing these systems is crucial for maintaining performance, reliability, and security. Datadog is a cloud-based monitoring and observability platform that provides deep visibility into infrastructure, applications, logs, and security events in real time. With Datadog, organizations can monitor cloud environments, troubleshoot issues, improve security, and optimize application performance.
This blog explores what Datadog is, its use cases, features, architecture, installation process, and step-by-step tutorials for getting started.
What is Datadog?
Datadog is a unified monitoring and security platform designed for cloud applications, providing observability across infrastructure, applications, logs, security, and real-time analytics. It enables DevOps teams, IT operations, and security professionals to track performance metrics, analyze logs, detect anomalies, and respond to incidents proactively.
Datadog integrates seamlessly with cloud providers like AWS, Azure, Google Cloud, and supports a wide range of technologies, including Kubernetes, Docker, databases, and serverless functions.
Key highlights of Datadog:
- Real-time monitoring of applications, servers, and cloud environments.
- Log management for centralized storage, analysis, and troubleshooting.
- Security monitoring to detect and mitigate threats.
- AI-driven anomaly detection for predictive insights.
- Custom dashboards and alerts for proactive system management.
Datadog simplifies observability by providing a single pane of glass for tracking logs, infrastructure metrics, and application performance, making it essential for modern cloud-native organizations.
Top 10 Use Cases of Datadog
- Infrastructure Monitoring
- Tracks CPU, memory, disk usage, and network performance of cloud and on-premises infrastructure.
- Ensures system health and prevents outages.
- Application Performance Monitoring (APM)
- Monitors application response times, dependencies, and errors.
- Helps developers optimize performance and detect bottlenecks.
- Log Management and Analysis
- Collects, stores, and analyzes logs from applications, servers, and cloud services.
- Enables quick debugging and forensic investigations.
- Cloud Cost Optimization
- Provides insights into cloud resource consumption.
- Identifies underutilized resources to reduce costs.
- Security and Compliance Monitoring
- Detects security threats and misconfigurations in real time.
- Helps organizations meet compliance requirements like PCI-DSS and GDPR.
- Kubernetes and Container Monitoring
- Monitors Kubernetes clusters, pods, and containers.
- Provides visibility into microservices performance and resource allocation.
- DevOps and CI/CD Pipeline Monitoring
- Integrates with Jenkins, GitHub Actions, and other CI/CD tools.
- Tracks deployment performance and detects issues early.
- Synthetic Monitoring for API and Website Uptime
- Simulates user interactions to monitor API and website availability.
- Detects performance degradation before users are affected.
- Serverless and Cloud Function Monitoring
- Monitors AWS Lambda, Azure Functions, and Google Cloud Functions.
- Tracks execution times, failures, and resource consumption.
- Business Intelligence and Analytics
- Uses custom metrics to track KPIs and business-critical functions.
- Helps make data-driven decisions for scaling and optimizing operations.

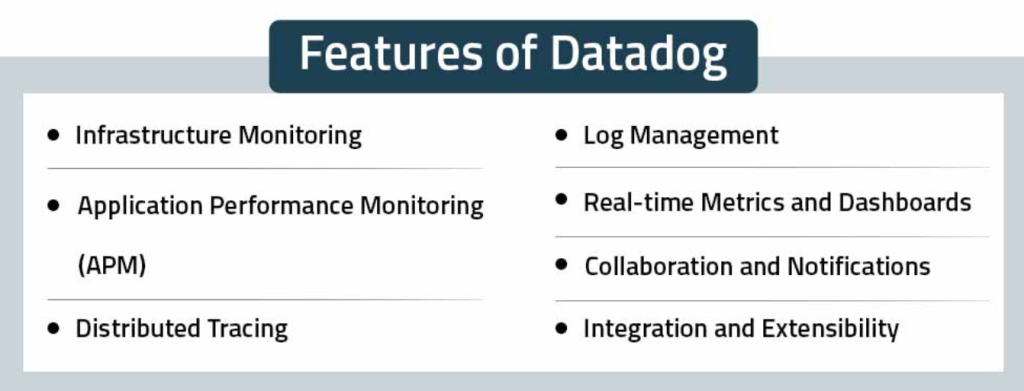
What Are the Features of Datadog?
- Infrastructure Monitoring
- Provides real-time monitoring of servers, databases, and network devices.
- Application Performance Monitoring (APM)
- Traces requests across distributed services to detect latency issues.
- Log Management and Analysis
- Centralizes log storage and enables querying for troubleshooting.
- Security Monitoring
- Detects security threats, vulnerabilities, and compliance risks.
- Custom Dashboards
- Allows users to create interactive dashboards for monitoring key metrics.
- Machine Learning-Based Anomaly Detection
- Uses AI-driven insights to detect unusual behavior in systems.
- Integration with Cloud Providers and DevOps Tools
- Supports AWS, Azure, Google Cloud, Kubernetes, Docker, Terraform, and more.
- Synthetic Monitoring and Real User Monitoring (RUM)
- Tests APIs, web applications, and mobile experiences to ensure optimal performance.
- Alerting and Incident Response
- Sends notifications via Slack, PagerDuty, email, and other integrations.
- Auto-Scaling and Load Balancing Optimization
- Helps organizations optimize cloud costs by tracking resource consumption.

How Datadog Works and Architecture
How It Works
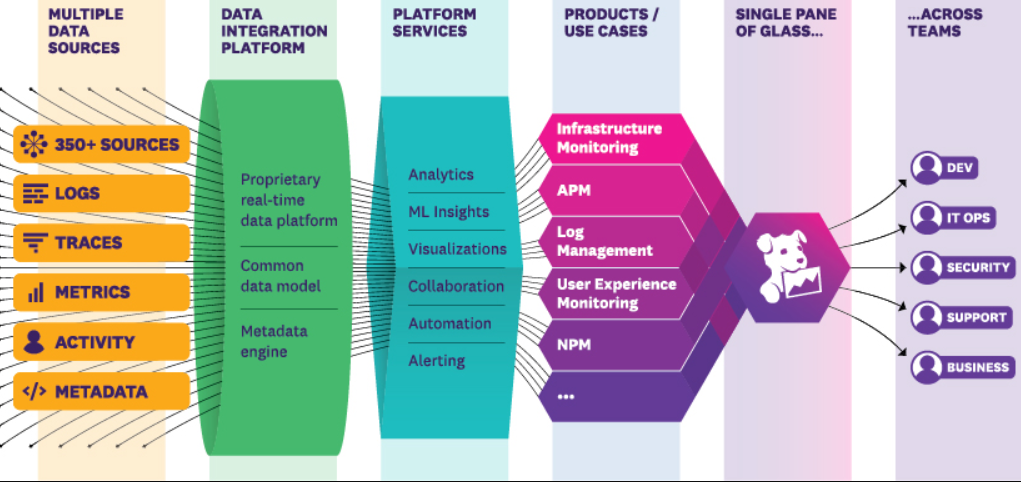
Datadog collects telemetry data (metrics, logs, traces, and events) from multiple sources and provides real-time analysis through interactive dashboards, alerts, and AI-driven insights. It allows IT teams to correlate logs, application performance, and security metrics in one platform for complete observability.
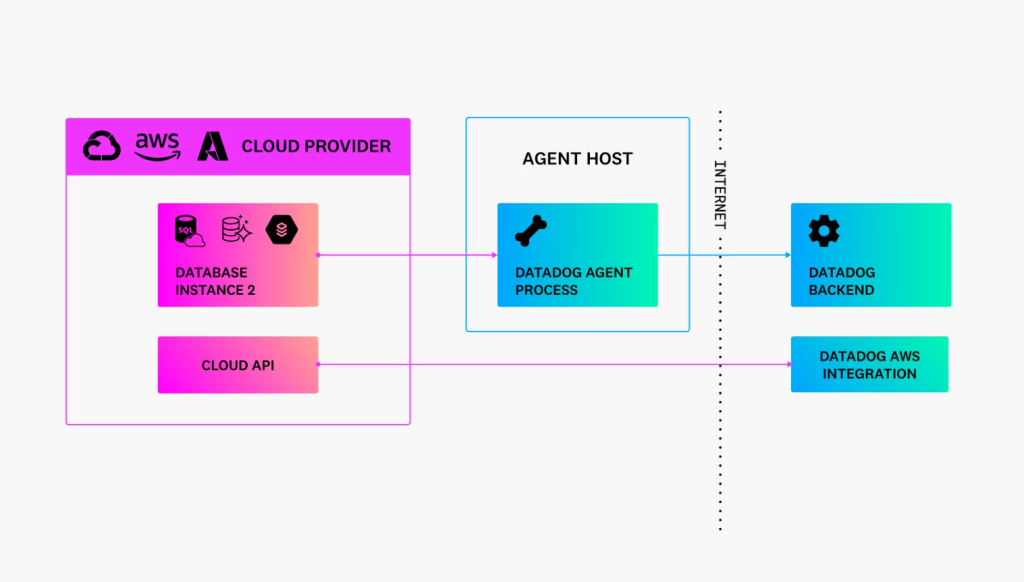
Architecture Overview
- Data Sources:
- Cloud providers (AWS, Azure, GCP)
- On-premises servers and virtual machines
- Applications and microservices
- Network devices and security tools
- Data Collection:
- Uses Datadog Agents to collect system and application metrics.
- Integrates with APIs and third-party tools for additional data.
- Data Processing and Storage:
- Stores logs, metrics, and traces in a time-series database.
- Analyzes data in real-time using AI-driven algorithms.
- Visualization and Insights:
- Provides custom dashboards and automated reports.
- Alerting and Incident Management:
- Sends alerts based on pre-defined thresholds or AI anomaly detection.
How to Install Datadog
1. Create a Datadog Account
- Sign up at Datadog’s website and get an API key.
2. Install the Datadog Agent on a Server
- For Linux:
DD_API_KEY=<YOUR_API_KEY> bash -c "$(curl -L https://s3.amazonaws.com/dd-agent/scripts/install_script.sh)"- For Windows:
- Download the Datadog Agent installer from the official website and follow setup instructions.
3. Verify Installation
- Run:
datadog-agent status4. Integrate with Cloud Services
- Go to Integrations > AWS, Azure, or GCP and connect your cloud account.
5. Configure Dashboards and Alerts
- In the Datadog dashboard, create a new dashboard and add widgets to visualize key metrics.
- Set up alert conditions to notify teams of performance issues.
Basic Tutorials of Datadog: Getting Started
1. Creating a Dashboard
- Navigate to Dashboards > Create New Dashboard.
- Add widgets to monitor CPU, memory, and application latency.
2. Setting Up Alerts
- Go to Monitors > Create Monitor.
- Select a metric (e.g., CPU Usage > 80%) and define a notification channel.
3. Analyzing Logs
- Navigate to Logs > Live Tail and apply filters to troubleshoot issues.
4. Enabling APM for an Application
- Add Datadog’s APM libraries to your codebase and configure tracing.
5. Integrating with Kubernetes
- Deploy the Datadog Agent in a Kubernetes cluster using Helm:
helm install datadog-agent --set datadog.apiKey=<YOUR_API_KEY> datadog/datadog