As businesses adopt complex digital systems and applications to improve customer experience, streamline operations, and stay ahead of competitors, the need for effective monitoring and performance management solutions becomes ever more critical. Dynatrace, a leading software intelligence platform, helps organizations gain deep insights into their software applications, infrastructure, and user experiences. It uses AI-powered automation and full-stack monitoring to ensure optimal performance, identify potential issues before they affect end users, and improve the digital experience. In this post, we’ll explore what Dynatrace is, its use cases, and how it works, so you can better understand how this powerful tool can support your business
What is Dynatrace?
Dynatrace is a comprehensive, AI-powered monitoring and performance management platform designed to help businesses manage, monitor, and optimize their digital ecosystems. Whether it’s applications, servers, databases, or user experiences, Dynatrace provides businesses with real-time insights into the health and performance of their entire technology stack. From cloud environments to on-premises infrastructures, Dynatrace excels at monitoring dynamic environments, such as microservices architectures, and provides both automated anomaly detection and actionable insights.
With the increasing complexity of today’s IT environments, Dynatrace leverages a unique approach called “full-stack observability,” meaning it can monitor and analyze data across all layers of a digital system. It gathers insights from applications, servers, databases, cloud services, networks, and more, providing businesses with an integrated, holistic view of their operations. Through its advanced AI capabilities, Dynatrace enables businesses to detect and resolve issues before they impact end-users, improving operational efficiency and enhancing the overall customer experience.
Top 10 Use Cases of Dynatrace
- Application Performance Monitoring (APM)
One of the core capabilities of Dynatrace is its ability to monitor the performance of applications in real-time. It helps businesses keep track of metrics like response times, error rates, and transaction volumes. Dynatrace identifies performance bottlenecks and provides in-depth diagnostics, enabling businesses to deliver a seamless user experience while minimizing downtime. - Infrastructure Monitoring
Dynatrace offers comprehensive infrastructure monitoring, ensuring that all components, from servers and databases to networking equipment, are functioning optimally. This visibility allows IT teams to proactively address performance issues and avoid any infrastructure-related disruptions. - Cloud Monitoring
With the rise of cloud environments like AWS, Google Cloud, and Microsoft Azure, businesses need robust tools to monitor these platforms. Dynatrace provides cloud monitoring capabilities, enabling businesses to track cloud services and resources in real time. This helps optimize cloud costs and performance while ensuring scalability. - User Experience Monitoring
Dynatrace helps businesses monitor the experience of end users on websites and mobile applications. By tracking key performance metrics, such as page load times, transaction performance, and error rates, it allows businesses to ensure that users always have a fast and flawless experience. - Root Cause Analysis (RCA)
When issues arise, pinpointing the exact cause is crucial to resolving them quickly. Dynatrace’s AI-driven root cause analysis automatically detects anomalies and drills down into the specific elements of a system that are causing problems. This drastically reduces troubleshooting time, ensuring faster resolutions and improved service reliability. - Microservices Monitoring
In today’s cloud-native environments, microservices play a key role in enabling scalability and flexibility. However, monitoring these decentralized components can be challenging. Dynatrace excels at monitoring microservices architectures, offering deep visibility into distributed systems to ensure all services are functioning properly. - Real-Time Data Analytics
Dynatrace collects real-time data from your applications, infrastructure, and end-users, offering up-to-the-minute insights. This enables businesses to make data-driven decisions quickly and respond to issues proactively. - Log Monitoring and Management
Dynatrace’s log management features help businesses aggregate and analyze logs across systems in real time. By understanding log data, organizations can diagnose issues, track system performance, and identify areas for improvement in their infrastructure and applications. - Synthetic Monitoring
Dynatrace’s synthetic monitoring simulates user interactions on websites and mobile applications, allowing businesses to monitor availability and performance from a global perspective. This preemptive monitoring helps businesses identify issues that could affect the end-user experience before users even notice. - AI-Driven Automation
Leveraging the power of AI, Dynatrace automates various monitoring processes, including anomaly detection, problem resolution, and predictive analytics. This automation reduces manual intervention, enabling IT teams to focus on strategic initiatives while ensuring that operations run smoothly without constant oversight.
What are the Features of Dynatrace?
Dynatrace offers a wealth of powerful features designed to streamline monitoring and improve performance management:
- AI-Powered Automation: Dynatrace utilizes artificial intelligence (AI) to automatically detect issues, analyze performance data, and even take corrective actions when necessary, reducing IT teams’ manual workload.
- Full-Stack Observability: From front-end applications to back-end infrastructure, Dynatrace provides end-to-end visibility across the entire technology stack, including serverless environments and cloud-native architectures.
- Cloud-Native Monitoring: Dynatrace’s monitoring capabilities are tailored to work seamlessly with cloud-native applications, microservices, and containerized environments, ensuring comprehensive visibility in modern IT environments.
- Real-Time Monitoring: Dynatrace offers up-to-the-minute visibility into application and infrastructure performance, helping businesses address issues as soon as they arise, and ensuring a smooth user experience at all times.
- Distributed Tracing: Dynatrace provides powerful tracing capabilities that allow businesses to track transactions through multiple services and applications. This helps IT teams identify where performance bottlenecks occur in complex, distributed systems.
- Unified Monitoring: With Dynatrace, businesses no longer need to rely on multiple monitoring solutions. Everything from APM and infrastructure monitoring to user experience and synthetic monitoring is available in a single unified platform.
How Dynatrace Works and Architecture?

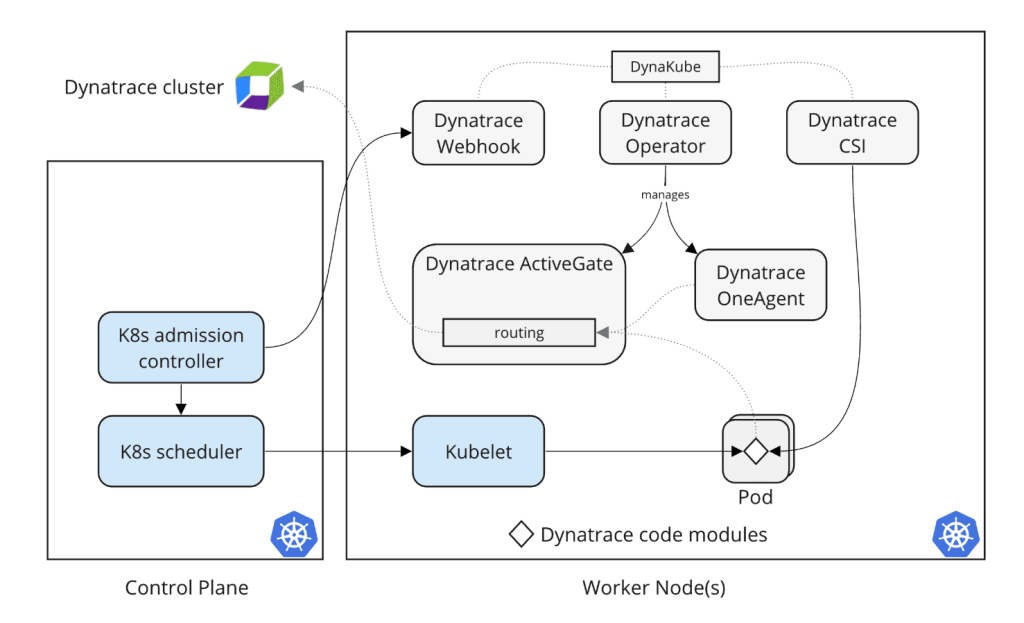
Dynatrace’s architecture is built around three key components:
- OneAgent: The core of Dynatrace, OneAgent is a lightweight software agent installed on servers, virtual machines, and cloud instances to collect data on application and infrastructure performance. It automatically detects and monitors everything, from services and processes to databases and cloud environments.
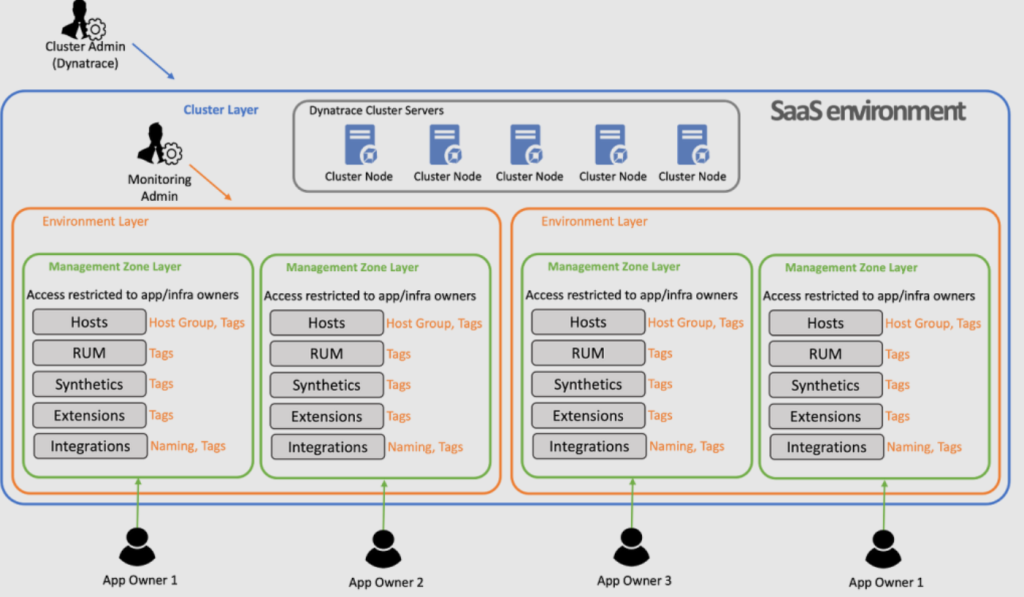
- Dynatrace Cluster: The platform’s backend infrastructure that processes, stores, and analyzes the collected data. It ensures that all insights are quickly available and provides a secure and scalable data processing environment.
- Dynatrace Web Interface: The user-friendly web interface gives IT teams and business leaders easy access to the platform’s insights. It provides dashboards, reports, and alerts that display key performance metrics in an intuitive and actionable format.
The OneAgent collects data and sends it to the Dynatrace Cluster, where it’s processed and analyzed. The insights are then made available through the web interface, giving businesses the ability to monitor their systems, respond to performance issues, and optimize their IT environments.
How to Install Dynatrace?
Here’s a simple guide on how to install Dynatrace:
Steps to Install Dynatrace:
- Sign Up for Dynatrace:
- Visit Dynatrace’s website and sign up for a free trial or purchase a plan based on your requirements.
- Download OneAgent:
- Once you have logged into your Dynatrace account, go to the “Deploy Dynatrace” section.
- Select your environment (e.g., Windows, Linux, Kubernetes, Docker) and download the OneAgent installer.
- Install OneAgent:
- Run the downloaded installer on your server or environment where you want to monitor the system.
- The installation process is simple: follow the on-screen instructions, and it will automatically install the agent on your machine.
- Verify the Installation:
- Once installed, the OneAgent will begin monitoring the system and reporting metrics to your Dynatrace dashboard.
- Log in to your Dynatrace account and check the Monitoring section to see if the agent is successfully collecting data.
- Access the Dashboard:
- After installation, you can view your system’s health and performance in real-time from the Dynatrace web interface.
Additional Setup (Optional):
- Configure Alerts: Set up custom alerts for issues you want to monitor.
- Monitor Specific Services: Use the Dynatrace dashboard to track applications, infrastructure, and user experience.
Basic Tutorials of Dynatrace: Getting Started
Once Dynatrace is installed, it’s time to explore its features and get started with monitoring:
- Familiarize Yourself with the Dashboard: The Dynatrace dashboard is the central hub where you can view all your performance data, set up alerts, and navigate to detailed insights.
- Set Up Custom Dashboards: Create customized dashboards that display key performance metrics relevant to your business needs. Whether it’s response times, error rates, or server load, you can configure your dashboards for maximum visibility.
- Configure Alerts: Dynatrace allows you to set up real-time alerts for any performance issues. Set thresholds for critical metrics to ensure that you are notified when something goes wrong.
- Monitor Applications: Start tracking the performance of your applications. You’ll be able to see detailed metrics such as response times, error rates, and transaction data.
- Monitor Microservices and Cloud Environments: Dynatrace provides specialized tools for monitoring modern, microservices-based architectures and cloud environments, ensuring that all your systems are properly optimized.