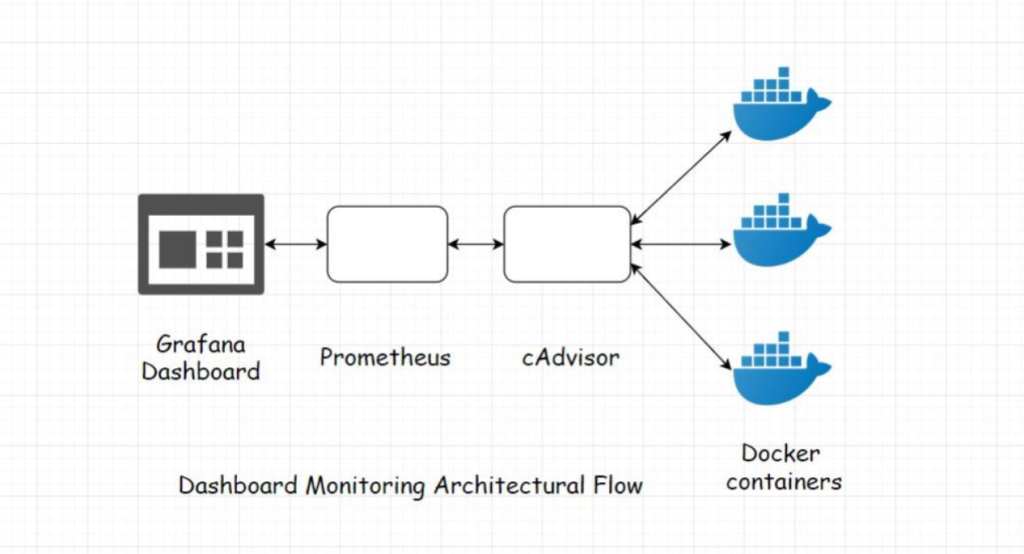
As data-driven decision-making becomes integral to modern IT and business operations, tools for visualizing and analyzing data are more critical than ever. Grafana is a leading open-source platform for monitoring, visualization, and analytics. With its ability to unify data from multiple sources and provide real-time, customizable dashboards, Grafana empowers teams to monitor systems, identify trends, and troubleshoot issues effectively.
Grafana is used by DevOps engineers, IT administrators, and business analysts to gain actionable insights, ensuring performance, reliability, and efficiency across applications and infrastructure.
What is Grafana?
Grafana is an open-source analytics and visualization platform that allows users to query, visualize, and analyze data from various sources in real time. It provides a unified interface to create dynamic dashboards, enabling users to monitor key metrics, detect anomalies, and drill down into specific data points.
Grafana supports a wide range of data sources, including Prometheus, Elasticsearch, MySQL, AWS CloudWatch, InfluxDB, and more. Its flexibility, extensibility, and powerful alerting capabilities make it a vital tool for observability in modern IT and DevOps environments.
Top 10 Use Cases of Grafana
- Infrastructure Monitoring
Visualize and monitor metrics like CPU usage, memory utilization, and disk performance across servers and virtual machines. - Application Performance Monitoring (APM)
Track application metrics, such as request latency, error rates, and throughput, to ensure optimal performance. - Kubernetes Observability
Monitor Kubernetes clusters, including pods, nodes, and services, for performance and resource utilization. - Database Performance Monitoring
Analyze query performance, connection counts, and resource usage for databases like MySQL, PostgreSQL, and MongoDB. - DevOps CI/CD Monitoring
Track build pipelines, deployment statuses, and test results for DevOps workflows. - Cloud Resource Monitoring
Monitor cloud services like AWS, Azure, and Google Cloud for resource allocation, cost management, and performance. - IoT Data Visualization
Process and display metrics from IoT devices, such as sensor readings and device health. - Security Monitoring
Visualize security logs, intrusion attempts, and compliance metrics using integrations with tools like Elasticsearch and Splunk. - Business Analytics
Analyze sales trends, customer engagement, and operational metrics using data from business tools and APIs. - Custom Alerting Dashboards
Set up custom alerts and notifications for critical thresholds or anomalies across systems.

What Are the Features of Grafana?
- Dynamic Dashboards
Create real-time, interactive dashboards to visualize data from multiple sources. - Wide Range of Data Source Integrations
Supports over 60 data sources, including Prometheus, Graphite, Elasticsearch, MySQL, AWS CloudWatch, and more. - Customizable Panels
Design panels with different chart types, including heat maps, graphs, tables, and gauges. - Alerting and Notifications
Set up alerts for key metrics and send notifications via email, Slack, PagerDuty, or other channels. - Templated Dashboards
Use variables to create reusable and parameterized dashboards. - Query Builder and Editor
Build complex queries using Grafana’s query editor or the native query language of the data source. - User Management and Permissions
Implement role-based access control to manage user permissions and data visibility. - Extensible with Plugins
Extend Grafana’s functionality with community and custom plugins for additional visualizations or data sources. - Cross-Platform Support
Grafana is platform-agnostic and can run on Linux, Windows, macOS, or containers. - Open-source and Active Community
Benefit from a robust, open-source ecosystem with frequent updates and a vibrant community.
How Grafana Works and Architecture
How It Works:
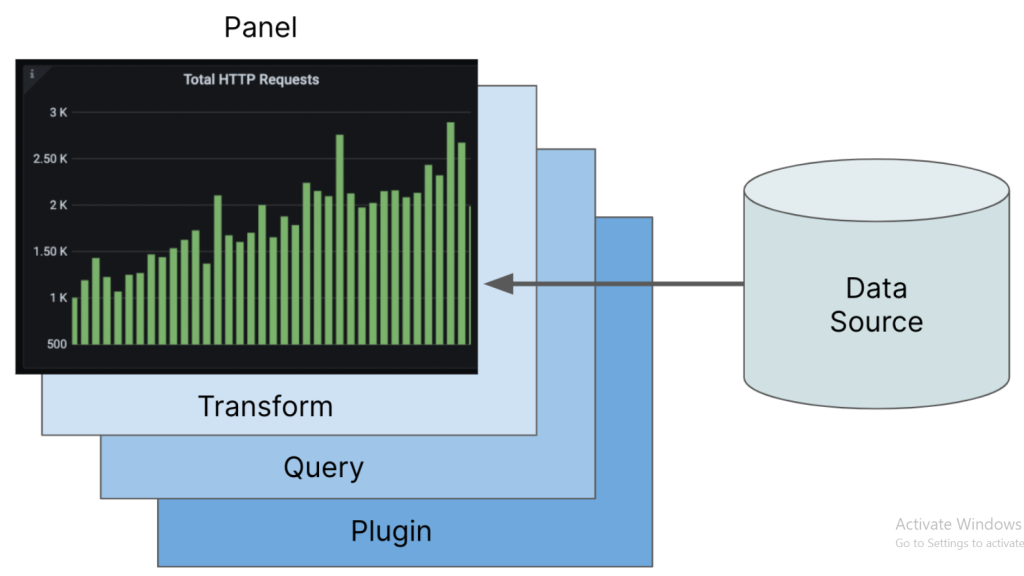
Grafana connects to one or more data sources, retrieves data through queries, and displays it in user-defined dashboards. It uses plugins to integrate with data sources and supports a variety of visualization options for data representation.
Architecture Overview:
- Data Sources:
Grafana connects to databases, monitoring tools, or cloud services as data sources. - Query Engine:
Executes queries against data sources using their respective APIs or query languages. - Dashboards:
Dashboards display visualizations, panels, and metrics for user-defined configurations. - Plugins:
Extend functionality with data source, panel, and application plugins. - Alerting System:
Monitors metrics and sends alerts when predefined conditions are met. - User Access Control:
Manages users, roles, and permissions to ensure data security and accessibility.
How to Install Grafana
Steps to Install Grafana on Linux:
- Download the Grafana Package:
- Visit the Grafana Downloads Page.
- Add the Grafana repository:
sudo apt-get install -y software-properties-common
sudo add-apt-repository "deb https://packages.grafana.com/oss/deb stable main"2.Install Grafana:
sudo apt-get update
sudo apt-get install grafana3.Start Grafana Server:
sudo systemctl start grafana-server
sudo systemctl enable grafana-server4.Access the Grafana Interface:
- Open your browser and navigate to
http://<your_server_ip>:3000. - Log in with the default credentials (username:
admin, password:admin) and set a new password.
5. Add a Data Source:
- In the Grafana dashboard, go to “Configuration” > “Data Sources.”
- Select a data source (e.g., Prometheus, MySQL, or Elasticsearch) and configure its connection settings.
6. Create a Dashboard:
- Go to “Create” > “Dashboard” and add panels for visualizing metrics from the connected data sources.
Basic Tutorials of Grafana: Getting Started
- Adding a Data Source:
- Navigate to “Configuration” > “Data Sources” and choose a data source type.
- Enter connection details, such as endpoint URLs and authentication credentials.
- Creating a Dashboard:
- Click “Create” > “Dashboard” and add a new panel.
- Select the data source, define the query, and choose the visualization type.
- Configuring Alerts:
- Open a panel, go to the “Alert” tab, and set thresholds for triggering alerts.
- Configure notification channels like email, Slack, or PagerDuty.
- Using Variables in Dashboards:
- Define variables to create reusable dashboards that adapt dynamically based on selected values.
- Integrating with Prometheus:
- Add Prometheus as a data source and visualize metrics like CPU usage or memory utilization.
- Use PromQL queries for precise metric analysis.
- Sharing Dashboards:
- Share dashboards via links or export them as JSON files for version control and portability.