Introduction
In the world of IT operations and security, log management is critical for maintaining system performance, ensuring security, and troubleshooting issues. Graylog is an open-source log management platform that provides users with the ability to centralize and analyze logs from various systems in real-time. This powerful tool is used for monitoring, security, and compliance purposes, offering valuable insights that help improve business and IT operations.
What is Graylog?
Graylog is a log management and analysis platform that collects, indexes and analyzes machine-generated data. It is designed to handle large volumes of logs from various sources, allowing users to monitor, search, and visualize log data from multiple systems in real-time. Graylog is widely used for IT infrastructure monitoring, application performance analysis, and security incident detection.
Graylog provides powerful search capabilities, customizable dashboards, and alerting functionalities to detect anomalies and respond to issues promptly. It is often used in environments that require centralized log management for security, compliance, and troubleshooting purposes.
Top 10 Use Cases of Graylog
- Security Information and Event Management (SIEM):
Graylog is commonly used to collect and analyze security logs to detect potential security incidents, threats, and vulnerabilities in real-time. - Log Aggregation and Centralization:
It centralizes logs from multiple systems and applications, making it easier to manage and analyze them from a single platform. - Infrastructure Monitoring:
Graylog helps monitor the health and performance of IT infrastructure by analyzing logs from servers, routers, and switches. - Application Performance Monitoring (APM):
Graylog can be used to monitor the performance of applications by aggregating logs and tracking performance issues in real time. - Compliance Monitoring and Auditing:
Graylog helps businesses maintain compliance with regulations by providing continuous logging and auditing of key system activities and transactions. - Troubleshooting and Debugging:
Graylog is widely used in IT environments to quickly identify and troubleshoot issues, reducing downtime and improving system reliability. - Cloud Monitoring:
Graylog is used to monitor cloud-based applications and infrastructure by aggregating logs from cloud services and virtual environments. - Real-time Alerts and Notifications:
Users can configure Graylog to send real-time alerts when specific conditions or thresholds are met, such as when an error occurs or when unusual activity is detected. - Operational Intelligence:
Graylog helps organizations gain operational intelligence by analyzing log data to gain insights into business processes, performance, and usage patterns. - User Activity Monitoring:
By tracking logs from user interactions, Graylog is used to monitor and analyze user behavior for security and compliance purposes.
Features of Graylog
- Log Collection and Ingestion: Graylog can collect logs from various sources, including applications, systems, and network devices.
- Powerful Search Capabilities: It provides powerful search functionality to query and analyze large volumes of log data.
- Real-time Alerts and Notifications: Graylog allows users to configure alerts based on log data conditions or threshold breaches.
- Custom Dashboards: Users can create custom dashboards to visualize log data and monitor the health and performance of their systems.
- Scalability: Graylog is designed to scale easily and handle large volumes of log data in enterprise environments.
- Security Features: It has built-in security features such as role-based access control (RBAC) to ensure that only authorized users can access sensitive log data.
- Integrations: Graylog integrates with a wide range of third-party tools and services, including SIEM systems, monitoring tools, and alerting systems.
- Data Retention Management: Graylog provides tools for managing data retention policies, allowing users to retain logs for a specified period before they are archived or deleted.
How Graylog Works and its Architecture
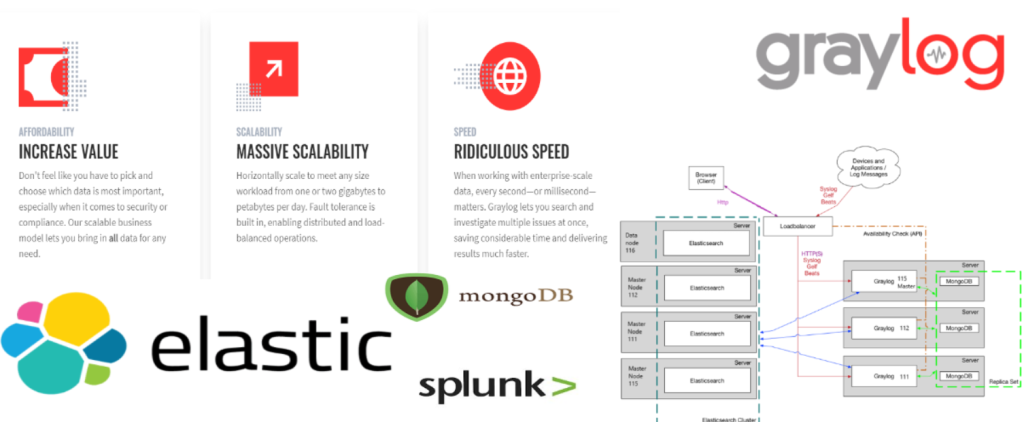
Graylog operates on a distributed architecture, with the following key components:
- Graylog Server: The core component that handles log processing, storage, and search functionality.
- Elasticsearch: Graylog uses Elasticsearch for indexing and storing log data, making it searchable and easily retrievable.
- MongoDB: MongoDB is used to store configuration data, user information, and metadata for Graylog.
- Inputs: Inputs are used to collect log data from various sources, such as syslog, file beats, and HTTP-based sources.
- Graylog Web Interface: The web interface allows users to interact with Graylog, search logs, configure alerts, and create dashboards.
Graylog ingests log data from multiple sources, indexes it in Elasticsearch, and stores it for easy retrieval. Users can search and analyze this data in real time using Graylog’s web interface, create visualizations, and set up alerts for specific conditions.
How to Install Graylog
- Download the Graylog Installer:
Go to the official Graylog website and download the installation package that matches your operating system. - Install Prerequisites:
Graylog requires Java, MongoDB, and Elasticsearch. Install these components before proceeding with the installation. - Install Graylog:
Follow the installation instructions provided by Graylog to set up the server on your system. You will need to configure Elasticsearch and MongoDB during the process. - Configure Graylog:
After installation, configure Graylog by editing the configuration file (graylog.conf). You will need to set up the database connection, Elasticsearch, and web interface settings. - Start Graylog Server:
Start the Graylog server, and access the web interface via the browser. You can begin configuring inputs, creating dashboards, and searching logs. - Add Data Sources:
Add your log data sources (e.g., syslog, application logs) to Graylog to begin collecting and analyzing logs.
Basic Tutorials of Graylog: Getting Started
- Create Your First Search Query:
Use the search bar to perform simple queries, such as searching for specific keywords or analyzing error logs. - Build Custom Dashboards:
Set up custom dashboards to visualize your log data in real time using charts, graphs, and tables. - Set Up Alerts:
Configure alerts to notify you of important events, such as error spikes or security threats, directly through email or integrated alerting systems. - Analyze Logs for Security Events:
Create search queries to filter security logs and identify potential threats or incidents within your system.