Introduction
In the fast-paced digital era, businesses and organizations depend heavily on their IT infrastructure to stay operational. The reliability of network devices, servers, and applications is paramount for continuous service delivery. This is where monitoring solutions like Icinga come into play. Whether you’re running a small local network or a global enterprise system, Icinga offers a robust and flexible platform to monitor your infrastructure’s health and performance.
In this blog, we will explore what Icinga is, delve into its top 10 use cases, analyze its features, understand its architecture and how it works, guide you through installation, and offer basic tutorials for getting started.
What is Icinga?
Icinga is a powerful open-source IT infrastructure monitoring system designed to keep track of the health, performance, and availability of servers, services, networks, and applications. Originally a fork of Nagios, Icinga has evolved into a comprehensive solution with enhanced capabilities for monitoring distributed environments and large-scale infrastructures.
It provides real-time monitoring and alerts users when critical issues arise, allowing businesses to mitigate downtime, ensure service continuity, and optimize performance. Whether for network monitoring, server monitoring, or application monitoring, Icinga is a versatile tool that can be customized to meet specific needs.
Top 10 Use Cases of Icinga
Icinga can be applied across a variety of IT environments, and its use cases are extensive. Here are the top 10 most popular use cases:
1. Server Monitoring
With Icinga, IT administrators can easily monitor physical and virtual servers for performance issues. Whether it’s tracking CPU load, memory usage, disk space, or network connectivity, Icinga ensures that your servers run optimally. It alerts you when resources are running low, or when there’s a threat of failure, giving you the ability to address problems before they affect service availability.
2. Network Monitoring
Networks are the backbone of every modern IT infrastructure, and any disruption can lead to significant operational downtime. Icinga continuously monitors network devices such as routers, switches, firewalls, and gateways to ensure smooth connectivity. It checks metrics like latency, packet loss, and throughput, sending notifications whenever abnormalities are detected.
3. Application Monitoring
Applications are critical to business operations, and their performance must be tracked continuously. Icinga helps monitor the performance of web servers (e.g., Apache, Nginx), databases (e.g., MySQL, PostgreSQL), and enterprise applications. It alerts administrators when an application fails or behaves unexpectedly, preventing service interruptions and data loss.
4. Cloud Infrastructure Monitoring
With the increasing adoption of cloud platforms, it’s crucial to monitor cloud resources effectively. Icinga supports monitoring cloud services, such as Amazon Web Services (AWS), Microsoft Azure, and Google Cloud. It tracks the health of virtual machines, cloud storage, and load balancers, helping you ensure that your cloud infrastructure is reliable and scalable.
5. Alerting and Notification
Icinga excels at alerting users when an issue is detected. Its notification system can send email, SMS, or mobile app alerts to IT staff, providing them with detailed information about the issue. The system can also be configured to notify different individuals or teams based on the severity of the problem, ensuring the right people take action quickly.
6. Distributed Monitoring
For large organizations with multiple remote locations, Icinga’s distributed monitoring capabilities are invaluable. It allows you to monitor different branches, data centers, or remote offices from a central location. Distributed monitoring ensures that all systems are monitored in real-time, providing a unified and comprehensive overview of your entire infrastructure.
7. Service Monitoring
Icinga can monitor specific services, including HTTP, DNS, FTP, and SMTP. This is critical for ensuring that essential services are available and performing well. For instance, if your website’s HTTP service fails, Icinga will notify you immediately so you can address the issue and restore service to your users.
8. Log File Monitoring
Log files provide important insights into the health of systems and applications. By integrating Icinga with log management solutions like Logstash or ElasticSearch, you can monitor log files for specific errors or issues. This allows IT staff to quickly identify problems or security threats and take corrective actions before they escalate.
9. Performance Data Analysis
Icinga doesn’t just alert you to problems—it also collects detailed performance data. By tracking system metrics over time, it enables you to visualize trends in resource usage, identify bottlenecks, and optimize your infrastructure. This performance analysis helps you plan capacity and prevent over-utilization.
10. Compliance Monitoring
For organizations that need to adhere to regulatory compliance standards, Icinga can be used to monitor system configurations and track compliance requirements. For example, Icinga can monitor whether a server has the appropriate patches or configurations to comply with standards like PCI-DSS, HIPAA, or GDPR.
What Are the Features of Icinga?
Icinga comes packed with features that make it a powerful monitoring tool for IT professionals. Some of its key features include:
- Real-Time Monitoring: Ensures continuous monitoring of hosts, services, and applications, detecting any issues as soon as they arise.
- Customizable Dashboards: Allows users to create dashboards tailored to their specific needs, providing a clear and easy-to-read overview of system performance.
- Scalable Architecture: Suitable for both small environments and large enterprises with complex infrastructures.
- Alerting and Notification: Multiple alerting options such as email, SMS, and mobile notifications when problems are detected.
- Performance Data Collection: Collects detailed metrics about system performance to help you analyze and optimize infrastructure.
- Web Interface (Icinga Web 2): Provides a user-friendly web interface that allows administrators to easily view, manage, and configure monitoring settings.
- Plugin Support: Icinga can be extended with a variety of plugins that allow monitoring of custom applications and services.
- Distributed Monitoring: Monitor multiple locations and infrastructures from a central server, offering complete visibility into your entire IT environment.
- Reporting: Generate detailed reports about the system’s availability, performance trends, and alerts.

How Icinga Works and Architecture
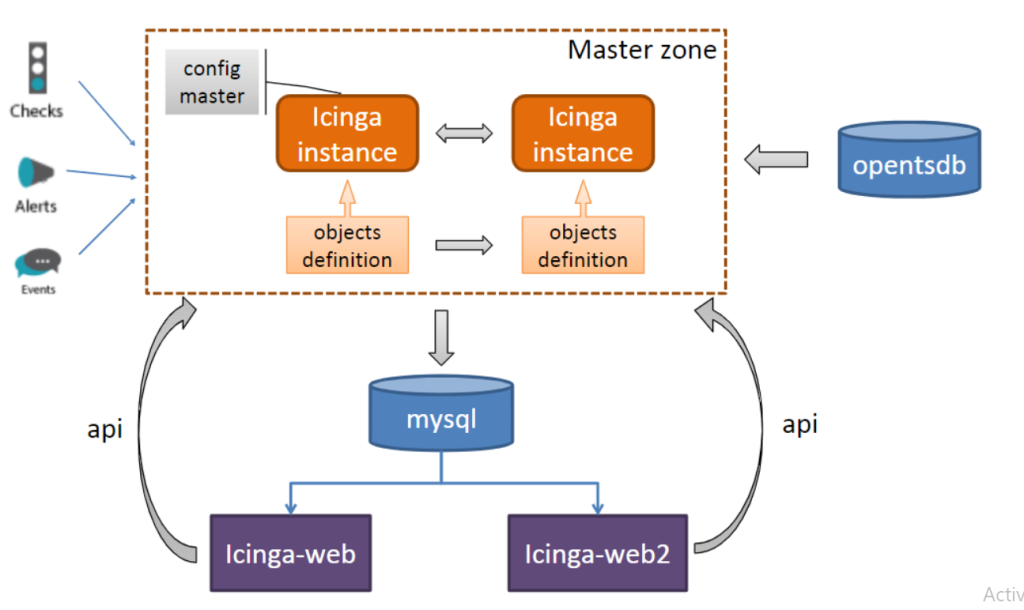
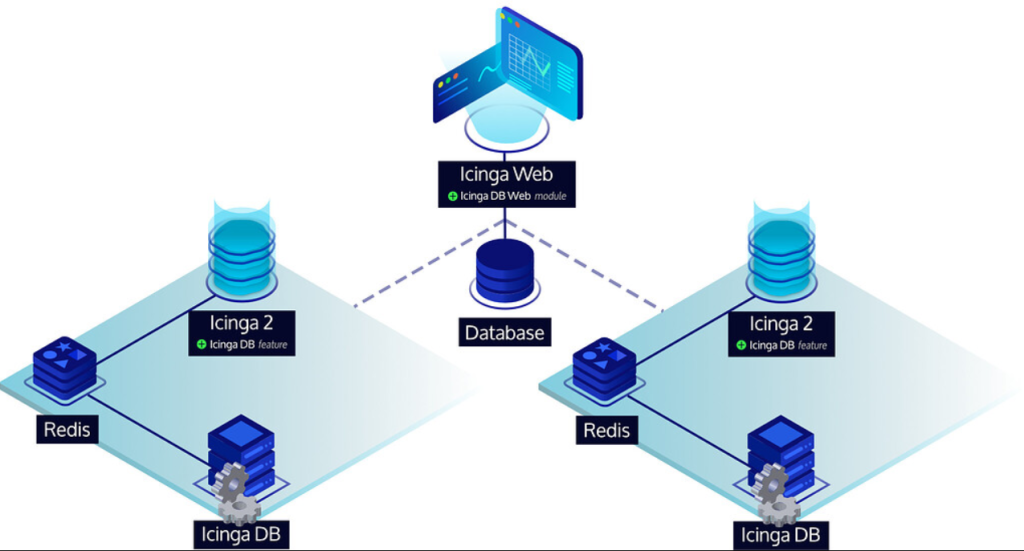
Icinga’s architecture is based on a client-server model, where the Icinga server is responsible for processing checks and generating alerts, while agents installed on hosts collect monitoring data. Here’s how it works:
- Icinga Core: The core of the system is responsible for processing checks, analyzing data, and sending alerts. It can be configured to monitor servers, services, and applications in real-time.
- Icinga Web: A web-based user interface used to interact with the monitoring system, view status information, and configure settings.
- Icinga Director: A configuration management interface that simplifies the setup of hosts, services, and monitoring parameters.
- Icinga Modules: Extend Icinga’s functionality with various pre-built plugins and integrations for enhanced monitoring capabilities.
This distributed architecture allows Icinga to monitor large-scale infrastructures, enabling flexibility and scalability.
How to Install Icinga?
The installation of Icinga can vary depending on your operating system. Below is a general installation guide for Linux-based systems.
Step 1: Install Dependencies
First, update your system’s package list and install any necessary dependencies:
sudo apt-get update
sudo apt-get install -y curl gnupg2 lsb-release ca-certificates
Step 2: Install Icinga2
Next, install the Icinga2 package:
bashCopysudo apt-get install -y icinga2 icingaweb2Step 3: Configure Icinga2
Once installed, start the Icinga2 service:
sudo systemctl start icinga2
sudo systemctl enable icinga2
Step 4: Access the Web Interface
Icinga provides a web interface called Icinga Web 2. Access it by navigating to http://<your-server-ip>/icingaweb2 and logging it using the default credentials.
Step 5: Configure Hosts and Services
Use the web interface to add hosts, configure monitoring services, set up notification rules, and customize dashboards.
Basic Tutorials of Icinga: Getting Started
After installing Icinga, you can begin monitoring your infrastructure by following these basic steps:
- Log in to Icinga Web: Access the Icinga Web interface using a browser and log in with your administrator credentials.
- Add Hosts: Navigate to the “Hosts” section and add servers or devices you wish to monitor. You’ll need to provide information like the IP address, and host name, and select a suitable monitoring template.
- Add Services: Once hosts are added, you can start adding services such as HTTP, DNS, or FTP. Icinga uses service checks to monitor the status of these services and report any failures.
- Set Up Notifications: In the “Notification” section, configure how you wish to be alerted when a service or host goes down. You can set up email alerts or SMS notifications for critical events.
- Monitor Your Infrastructure: Use Icinga’s powerful dashboards to monitor your system’s performance, health, and alerts in real-time. Make sure to regularly review the performance metrics and historical data to ensure everything is running smoothly.