In a rapidly evolving cloud-based IT environment, ensuring operational efficiency, application performance, and infrastructure health is paramount. Microsoft Azure Monitor, a comprehensive observability platform offered by Microsoft, is designed to meet these needs. By providing real-time monitoring, insights, and automation, Azure Monitor empowers organizations to optimize performance, maintain reliability, and troubleshoot effectively. This blog delves into what Azure Monitor is, its use cases, features, architecture, installation process, and step-by-step tutorials to get started.
What is Microsoft Azure Monitor?
Microsoft Azure Monitor is a cloud-native monitoring and observability solution that collects, analyzes, and visualizes telemetry data from Azure resources, applications, and on-premises systems. It enables IT teams to monitor the performance, availability, and health of their infrastructure and applications in real-time. Azure Monitor provides actionable insights that help organizations troubleshoot issues, ensure compliance, and optimize resource usage.
Key functionalities of Azure Monitor include:
- Unified monitoring for Azure, hybrid, and on-premises environments.
- Real-time telemetry for applications and infrastructure.
- Integrated alerts and automation for quick incident resolution.
- Customizable dashboards for data visualization.
Top 10 Use Cases of Microsoft Azure Monitor
- Application Performance Monitoring (APM)
Azure Monitor’s Application Insights tracks application metrics such as response times, dependencies, and error rates to optimize the user experience. - Infrastructure Health Monitoring
Provides real-time monitoring of Azure resources like Virtual Machines (VMs), storage accounts, and networks, ensuring operational efficiency. - Hybrid and Multi-Cloud Monitoring
Extends observability to on-premises environments and other cloud platforms through Azure Arc, enabling unified monitoring. - Log Analytics and Troubleshooting
Analyzes logs with Azure Log Analytics and Kusto Query Language (KQL) to detect and resolve issues quickly. - Service Level Objective (SLO) Monitoring
Tracks SLOs and ensures adherence to Service Level Agreements (SLAs), maintaining service reliability and performance. - Incident Detection and Alerting
Configures custom alerts based on specific thresholds or anomalies, ensuring quick detection of and response to critical incidents. - Autoscaling Resources
Monitors resource utilization and triggers autoscaling to manage workloads efficiently and cost-effectively. - Cost Optimization
Identifies underutilized resources and high-spending areas through performance and usage metrics. - Compliance and Security Monitoring
Tracks security logs, enforces compliance policies, and integrates with Azure Security Center to detect vulnerabilities. - DevOps Pipeline Monitoring
Integrates with DevOps tools like Azure DevOps and GitHub Actions to monitor CI/CD pipelines, deployments, and build performance.
What Are the Features of Microsoft Azure Monitor?
- Application Insights
Provides deep insights into application performance, dependencies, and user interactions. - Real-Time Metrics Collection
Tracks performance metrics for Azure and non-Azure resources, ensuring comprehensive visibility. - Log Analytics
Collects and queries log data using a powerful interface and KQL for root-cause analysis. - Custom Dashboards
Creates visualizations for metrics and logs using the Azure portal or third-party tools like Grafana. - Alerts and Notification Rules
Configures alert policies to notify teams via email, SMS, or integrations with tools like Slack and PagerDuty. - Integration with Azure Services
Works seamlessly with Azure-native tools like Azure Security Center, Azure Policy, and Azure Automation. - Cross-Environment Monitoring
Monitors hybrid and multi-cloud environments with Azure Arc and other connectors. - Autoscaling Support
Dynamically adjusts resource allocations based on monitored metrics. - Resource Dependency Mapping
Visualizes the interdependencies between resources for effective troubleshooting and impact analysis. - Anomaly Detection
Uses machine learning models to detect unusual patterns and deviations in metrics.

How Microsoft Azure Monitor Works and Architecture
How It Works
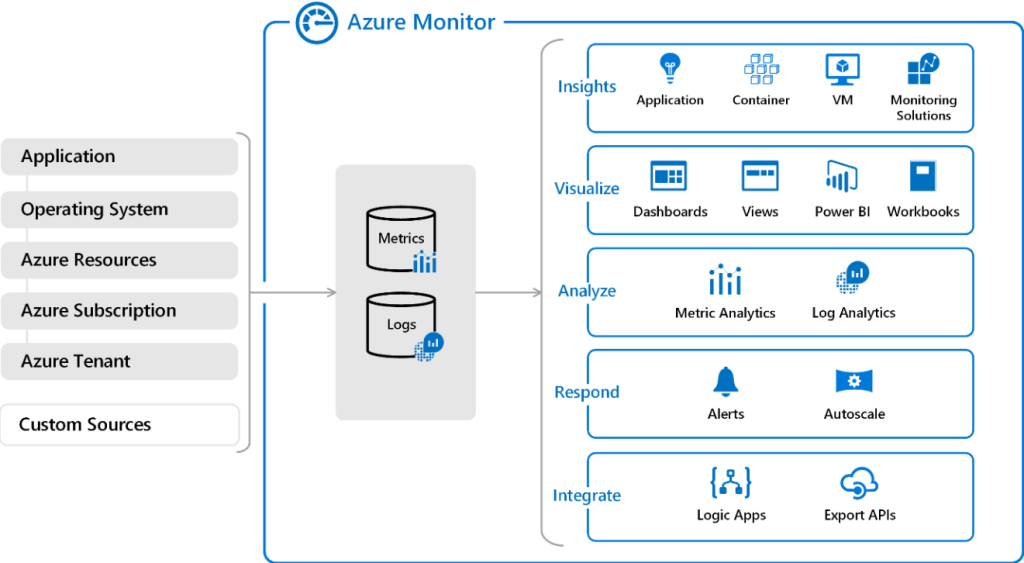
Azure Monitor operates by collecting telemetry data (metrics, logs, and traces) from various sources such as Azure services, custom applications, and on-premises systems. This data is stored in centralized repositories and analyzed to provide insights, alerts, and visualizations.
Architecture Overview
- Data Sources:
- Azure resources like VMs, App Services, and Databases.
- Custom applications using Application Insights SDK.
- On-premises and hybrid systems through Azure Arc.
- Data Collection:
- Metrics: Tracks real-time performance indicators like CPU utilization and response times.
- Logs: Collects textual event data from applications and systems.
- Data Processing and Storage:
- Metrics are stored in a time-series database for quick retrieval.
- Logs are stored in Azure Monitor Logs for querying and analysis.
- Analytics and Insights:
- Log Analytics for querying logs and identifying trends.
- Metrics Explorer for analyzing performance metrics.
- Alerts and Automation:
- Triggers actions based on predefined conditions, such as scaling or running automation scripts.
How to Install Microsoft Azure Monitor
1. Prerequisites
- An active Azure subscription.
- Admin access to the Azure portal.
2. Installation Steps
Enable Monitoring for Azure Resources:
- Go to the resource (e.g., Virtual Machine) in the Azure portal.
- Enable Diagnostics Settings to send metrics and logs to Azure Monitor.
- Navigate to Application Insights in the Azure portal.
- Create an instance for your application and integrate the provided instrumentation key with your code.
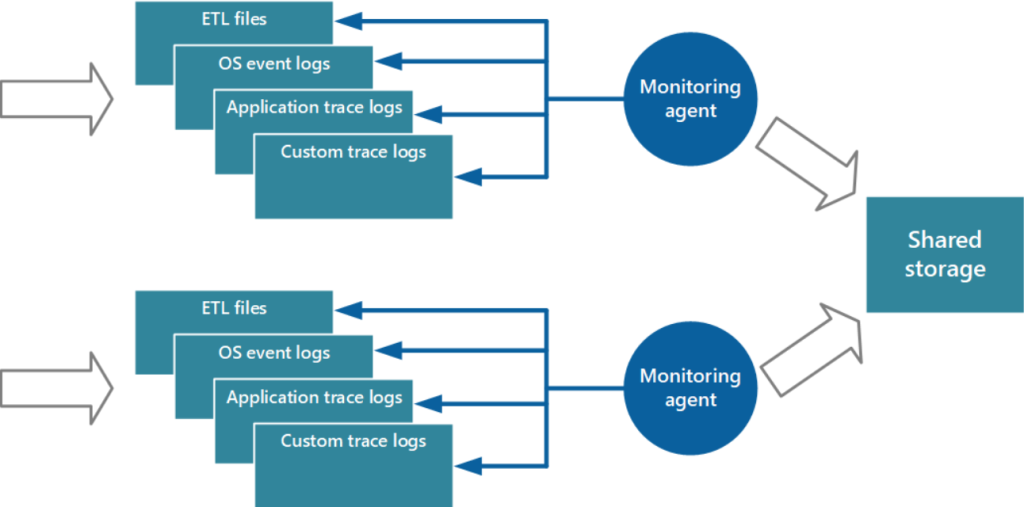
- For hybrid environments, install the Log Analytics agent:
wget https://raw.githubusercontent.com/Microsoft/OMS-Agent-for-Linux/master/installer/scripts/onboard_agent.sh
sudo sh onboard_agent.sh -w <workspace-id> -s <workspace-key>
3. Configure Alerts and Dashboards
- Create alert rules for specific metrics or logs and define notification actions.
- Build custom dashboards to visualize performance data.
Basic Tutorials of Microsoft Azure Monitor: Getting Started
1. Setting Up a Log Analytics Workspace
- Go to Log Analytics Workspaces in the Azure portal.
- Create a new workspace and link it to your resources.
2. Querying Logs with KQL
- Access Logs in Azure Monitor and use KQL to analyze data.
Example query:
AzureActivity
| where ActivityStatus == "Failed"
| summarize count() by ResourceGroup
3. Creating Alerts
- Set up an alert policy:
- Navigate to Azure Monitor > Alerts > Create Alert Rule.
- Define a condition like CPU utilization > 80%.
- Assign an action group for notifications.
4. Visualizing Metrics
- Use Metrics Explorer to create visualizations for performance metrics like disk I/O or network latency.
5. Using Application Insights
- Add the Application Insights SDK to your code and monitor application performance through the Azure portal.
6. Configuring Autoscaling
- Link Cloud Autoscale with Azure Monitor metrics to adjust resource allocations dynamically.