Effective monitoring is critical for maintaining reliability and performance in modern IT environments, where applications and infrastructure are increasingly complex and dynamic. Prometheus, an open-source monitoring and alerting toolkit, has become a cornerstone in the observability stack for cloud-native applications. Built by SoundCloud and now part of the Cloud Native Computing Foundation (CNCF), Prometheus is widely adopted for its flexibility, scalability, and ability to handle multi-dimensional data.
Prometheus collects metrics from configured targets at given intervals, evaluates rule-based conditions, and triggers alerts when conditions are violated. Its robust ecosystem makes it a favorite among DevOps teams and organizations adopting microservices and Kubernetes.
What is Prometheus?
Prometheus is an open-source systems monitoring and alerting toolkit designed for reliability, scalability, and efficiency. It collects and stores metrics as time-series data, which includes numerical values associated with a timestamp. Prometheus allows users to query and visualize metrics using its powerful query language, PromQL.
Prometheus is often used with Alertmanager to handle alerts and integrates seamlessly with visualization tools like Grafana. It is built for multi-dimensional data collection, making it ideal for monitoring cloud-native environments and containerized applications.
Top 10 Use Cases of Prometheus
- Infrastructure Monitoring
Track CPU, memory, and disk usage across servers and virtual machines. - Application Performance Monitoring (APM)
Measure application-level metrics such as request rates, response times, and error rates. - Kubernetes Monitoring
Monitor Kubernetes clusters, including pods, nodes, and services, using Prometheus exporters. - Service-Level Objectives (SLOs)
Define and monitor SLOs for uptime, latency, and availability metrics. - Custom Metrics Collection
Instrument applications to expose custom business or application metrics. - Alerting and Incident Management
Integrate with Alertmanager to send notifications based on defined conditions. - Database Monitoring
Monitor databases like MySQL, PostgreSQL, and MongoDB for query performance and resource utilization. - Distributed Systems Monitoring
Collect metrics from microservices to understand system performance and bottlenecks. - Cloud Resource Monitoring
Monitor cloud services and instances on AWS, Azure, and Google Cloud. - Network Performance Monitoring
Analyze network throughput, latency, and error rates for network devices.

What Are the Features of Prometheus?
- Multi-Dimensional Data Collection
Use labels to provide metadata for metrics, enabling flexible queries. - PromQL (Prometheus Query Language)
A powerful query language for aggregating, slicing, and dicing time-series data. - Time-Series Database (TSDB)
Store metrics as time-series data with efficient compression. - Pull-Based Data Collection
Scrape metrics from targets using HTTP endpoints, ensuring flexibility and control. - Service Discovery
Automatically discover targets using Kubernetes, Consul, or static configurations. - Built-In Alerting
Evaluate alerting rules and send alerts to Alertmanager. - Rich Ecosystem of Exporters
Exporters allow Prometheus to collect metrics from various applications, databases, and services. - Integration with Grafana
Visualize metrics in Grafana for insightful dashboards. - Scalability and Reliability
Handle large-scale monitoring needs with horizontal scaling and federation. - Open Source and Extensible
An active community and rich documentation ensure continuous improvement and extensibility.
How Prometheus Works and Architecture
How It Works:
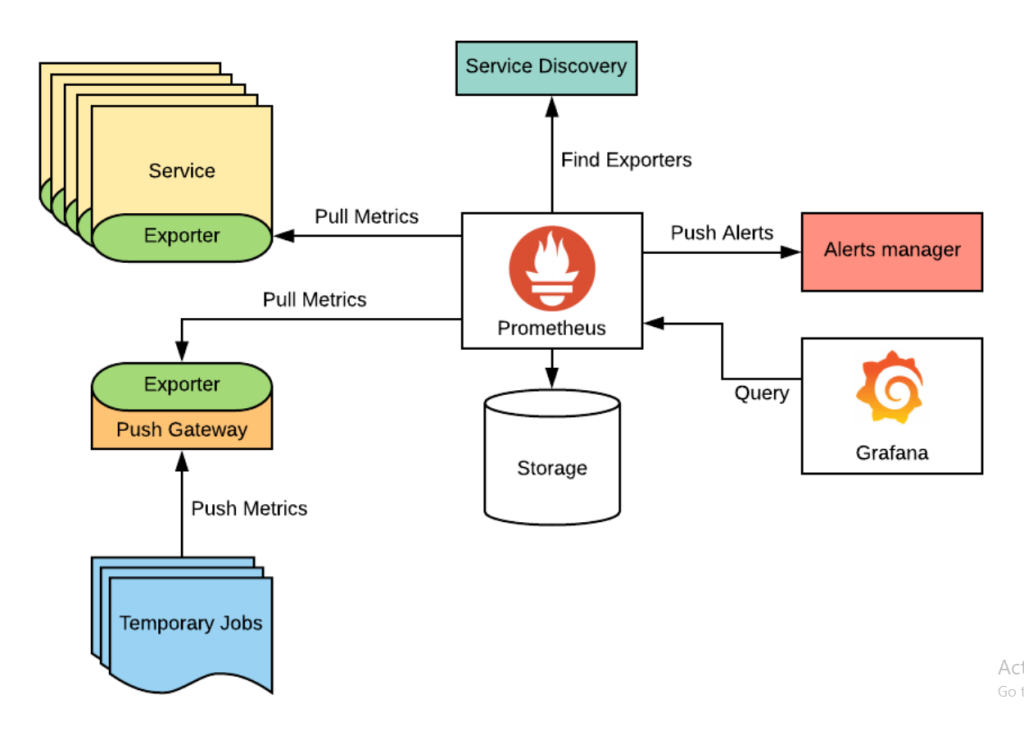
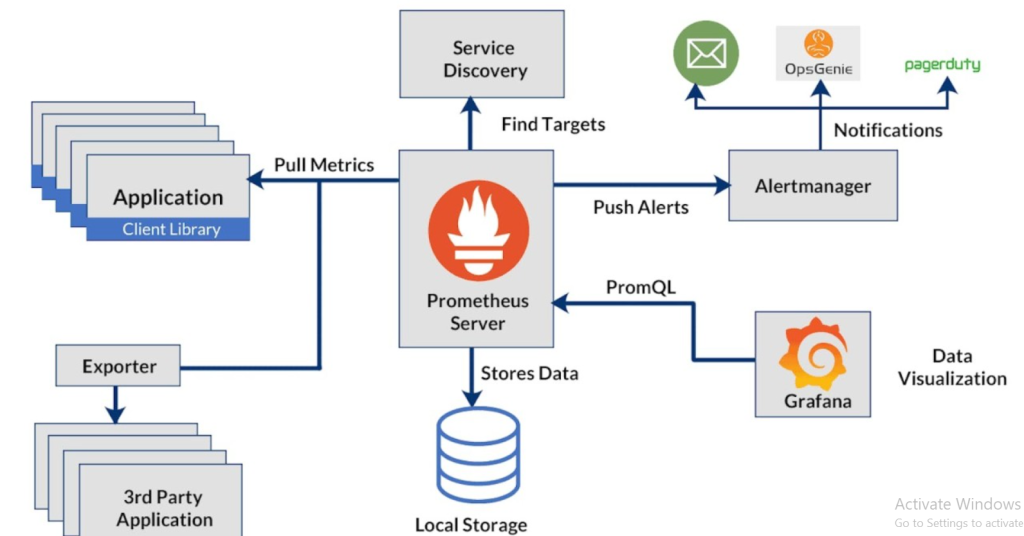
Prometheus collects metrics by scraping targets at specified intervals. These metrics are stored in a time-series database and can be queried using PromQL. Alerts are evaluated against rule-based conditions, and notifications are sent through Alertmanager.
Architecture Overview:
- Prometheus Server:
Scrapes and stores time-series data and handles queries. - Targets:
Applications or services exposing metrics in a format Prometheus can scrape. - Exporters:
Components that expose Prometheus metrics from services like databases and hardware. - Alertmanager:
Processes and route alerts generated by Prometheus. - Visualization Tools:
Use Grafana or other tools to visualize metrics and trends.
How to Install Prometheus
Steps to Install Prometheus on Linux:
1. Download Prometheus:
Visit the Prometheus downloads page and download the latest version.
wget https://github.com/prometheus/prometheus/releases/download/v<version>/prometheus-<version>.linux-amd64.tar.gz2. Extract the Package:
tar -xvf prometheus-<version>.linux-amd64.tar.gz
cd prometheus-<version>.linux-amd64
3. Run Prometheus:
Start Prometheus using the default configuration:
./prometheus --config.file=prometheus.yml4. Edit Configuration (Optional):
Update prometheus.yml to define scrape targets and alerting rules.
5. Access the Web Interface:
Open your browser and navigate to http://<server_ip>:9090 to access the Prometheus dashboard.
Basic Tutorials of Prometheus: Getting Started
1. Defining Scrape Targets
Edit the prometheus.yml file to add targets:
scrape_configs:
  - job_name: 'example-app'
    static_configs:
      - targets: ['localhost:8080']
2. Running a Query in PromQL
Use the Prometheus web interface to query metrics:
rate(http_requests_total[5m])3. Setting Up Alerts
Define alerting rules in the configuration file:
groups:
  - name: example-alert
    rules:
      - alert: HighCPUUsage
        expr: cpu_usage > 80
        for: 2m
        labels:
          severity: warning
4. Visualizing Metrics in Grafana
- Install Grafana and add Prometheus as a data source.
- Create dashboards to visualize metrics like CPU usage, memory, and network throughput.
5. Using Exporters
Install an exporter (e.g., Node Exporter) to monitor server metrics:
wget https://github.com/prometheus/node_exporter/releases/download/v<version>/node_exporter-<version>.linux-amd64.tar.gz6. Scaling with Federation
Configure Prometheus servers to scrape data from one another for scalability.