Introduction
As IT systems grow increasingly complex, ensuring the health and reliability of your infrastructure becomes essential. An effective monitoring tool helps identify and resolve issues before they become serious problems, ensuring seamless service delivery. Sensu is one such open-source monitoring tool that offers an advanced solution for monitoring servers, applications, networks, and other IT systems. In this blog, we’ll explore what Sensu is, dive into its top 10 use cases, discuss its features, architecture, and how it works, guide you through the installation process, and provide basic tutorials for getting started with Sensu.
What is Sensu?
Sensu is an open-source, scalable, and extensible monitoring solution designed for cloud-native environments, containers, and distributed systems. Developed by Sensu Inc., Sensu is built to offer enterprise-grade monitoring with a focus on flexibility, automation, and ease of use. Sensu is designed to handle monitoring across a wide range of IT resources, including infrastructure, applications, services, and even business processes.
Unlike traditional monitoring systems, Sensu provides an event-driven model that offers real-time monitoring and alerting capabilities. It allows you to aggregate performance data from multiple sources and provides notifications when problems are detected. Sensu helps IT teams keep systems up and running, reduce downtime, and ensure high availability.
Top 10 Use Cases of Sensu
Sensu is a versatile tool that can be applied in various monitoring scenarios. Let’s explore the top 10 use cases where Sensu excels.
1. Infrastructure Monitoring
Sensu allows IT professionals to monitor the health of physical and virtual infrastructure in real-time. It tracks server performance, including CPU usage, memory utilization, disk space, and more. By aggregating data from all systems, Sensu ensures that administrators can quickly identify any performance degradation and prevent downtime.
2. Cloud-Native Monitoring
As cloud adoption continues to grow, Sensu is an ideal choice for monitoring cloud-native infrastructures. Whether you are using AWS, Microsoft Azure, or Google Cloud, Sensu integrates seamlessly with cloud environments. It tracks cloud resources like virtual machines, storage, and load balancers, ensuring that cloud-based services remain operational and efficient.
3. Application Monitoring
For businesses relying on critical applications, Sensu provides real-time monitoring to ensure smooth operations. It supports a wide variety of applications, from web servers (Apache, Nginx) to databases (PostgreSQL, MySQL) and containerized applications. By continuously monitoring these applications, Sensu helps detect and fix issues before they impact users.
4. Network Monitoring
Network issues can cause significant disruptions, so it’s essential to monitor network devices like routers, switches, and firewalls. Sensu tracks the performance of these devices, checking for problems like packet loss, high latency, or failed services. By proactively monitoring the network, Sensu ensures your infrastructure stays connected and operational.
5. Container and Kubernetes Monitoring
With the rise of containerized applications and Kubernetes, Sensu provides native support for monitoring containerized workloads. It integrates seamlessly with container orchestration platforms like Kubernetes, helping track container health, resource utilization, and scalability. This is especially important for maintaining the reliability and performance of modern, dynamic application environments.
6. Microservices Monitoring
In distributed microservices architectures, each service can have its own health and performance metrics. Sensu enables the monitoring of microservices to ensure they are functioning correctly. It aggregates data from each microservice and provides real-time alerts when a microservice goes down or starts exhibiting abnormal behavior.
7. Log Aggregation and Monitoring
Logs are critical for troubleshooting and ensuring the proper functioning of applications and services. Sensu integrates with popular log aggregation tools like Elasticsearch and Logstash to collect, monitor, and analyze logs in real-time. This helps teams identify issues such as security threats, errors, or performance bottlenecks and address them proactively.
8. Automated Alerts and Notifications
Sensu allows you to set up automatic alerts and notifications for a wide variety of events. Whether it’s a critical infrastructure failure or a minor performance anomaly, Sensu sends real-time notifications to relevant team members via email, Slack, or other messaging platforms. The automated nature of Sensu’s alerts ensures that teams are always aware of system health and can take immediate action when required.
9. Compliance Monitoring
For businesses in regulated industries, compliance with industry standards (e.g., HIPAA, PCI-DSS) is essential. Sensu helps track system configurations, patch levels, and security settings to ensure they meet compliance requirements. By continuously monitoring these systems, Sensu makes it easier for businesses to maintain compliance and avoid costly penalties.
10. Performance Monitoring and Reporting
Monitoring system performance over time is key to identifying patterns, improving efficiency, and preventing potential failures. Sensu aggregates performance data and offers insights into resource utilization, trends, and overall system health. Its powerful reporting tools provide administrators with historical data and analytics that can inform decisions about infrastructure scaling and optimization.
What Are the Features of Sensu?
Sensu offers a rich set of features that make it a comprehensive solution for IT monitoring. Some of its key features include:
- Event-Driven Monitoring: Sensu uses an event-driven model to monitor system events in real-time, ensuring administrators receive immediate alerts.
- Cloud-Native and Distributed Architecture: Sensu is designed to scale with your infrastructure, whether on-premise, in the cloud, or in hybrid environments.
- Customizable Checks: Sensu supports a wide range of built-in checks, but users can also create custom checks using scripts or plugins.
- Multi-Cloud and Hybrid Monitoring: Sensu integrates seamlessly with public cloud providers like AWS, GCP, and Azure.
- Integration with Third-Party Tools: Sensu works well with a variety of third-party tools like PagerDuty, Slack, and Grafana for enhanced functionality.
- Dynamic Asset Management: Sensu allows you to dynamically manage and monitor assets like virtual machines, containers, and network devices.
- Alerting and Notification: Sensu provides robust alerting capabilities to notify administrators when problems arise, via multiple channels.
- Flexible API: Sensu offers a flexible API for easy integration with other systems, allowing users to automate tasks and workflows.
- Rich Plugin Ecosystem: The Sensu plugin ecosystem allows users to extend the monitoring functionality to suit their needs.
- Multi-Tenant Support: Sensu offers multi-tenant capabilities, making it ideal for service providers or large organizations with distinct teams or environments.

How Sensu Works and Architecture
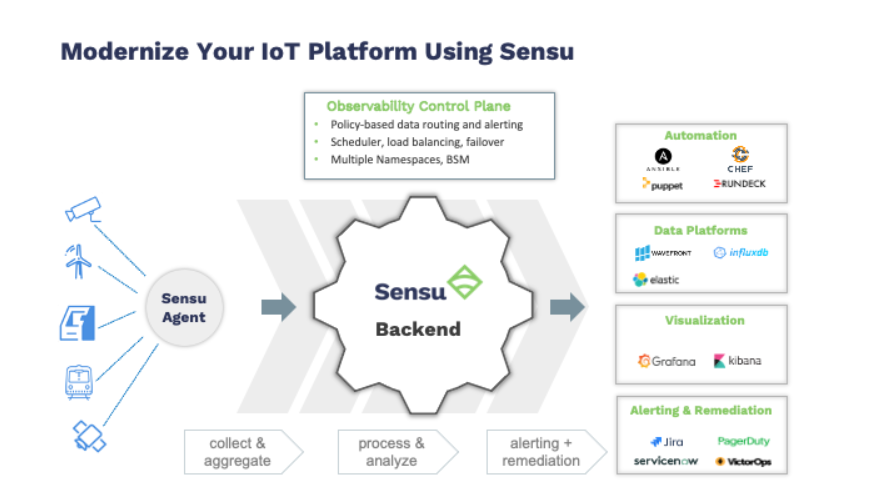
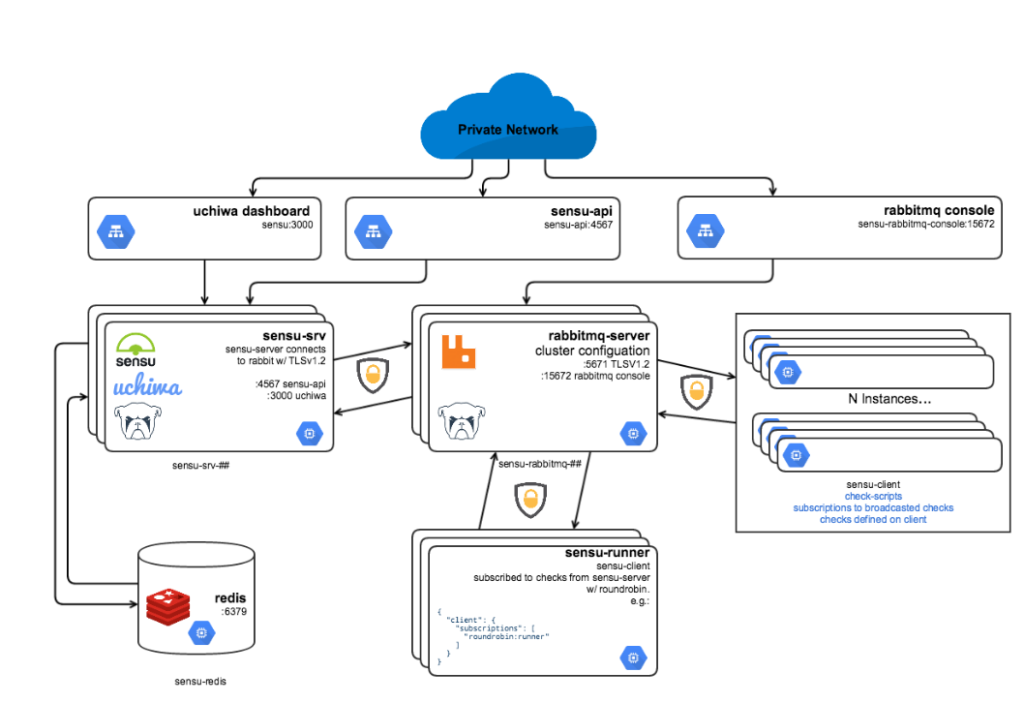
Sensu operates on a client-server architecture, where a centralized Sensu backend is responsible for managing events and triggering actions, while client agents are deployed on monitored systems to collect data.
- Sensu Backend:
The backend is the core of Sensu, responsible for receiving events from clients, processing checks, and triggering notifications. The backend can be deployed in a clustered configuration for high availability and scalability. - Sensu Agents:
Sensu agents are installed on monitored systems to collect performance data, execute checks, and send events to the backend. Agents run periodically to check the health of services and applications. - Sensu Enterprise:
Sensu offers an enterprise edition that adds additional features like enterprise-grade security, scalability, and more advanced analytics. - Check and Event Processing:
Sensu processes events generated by checks, including status updates, errors, and performance metrics. Sensu integrates with third-party tools to perform actions when certain thresholds are met, such as sending alerts or triggering automated remediation. - Sensu Dashboard:
Sensu offers a web-based dashboard that allows users to view metrics, configure monitoring settings, and receive notifications. The dashboard is fully customizable, providing a user-friendly way to manage monitoring tasks.
How to Install Sensu?
Installing Sensu involves the following steps, assuming you are using a Linux-based system (for example, Ubuntu):
Step 1: Install Dependencies
Ensure that you have the necessary dependencies installed, including curl and wget:
sudo apt-get update
sudo apt-get install -y curl wget
Step 2: Install the Sensu Package
Add the Sensu repository to your system and install Sensu components:
curl -s https://packagecloud.io/install/repositories/sensu/stable/script.deb.sh | sudo bash
sudo apt-get install sensu-go
Step 3: Configure Sensu
After installing Sensu, you need to configure it by editing configuration files, including the sensu-backend.yml for server settings and defining checks and clients for monitoring.
Step 4: Start Sensu Services
Start the Sensu backend services and agents:
sudo systemctl start sensu-backend
sudo systemctl enable sensu-backend
Step 5: Access the Web Interface
Once everything is up and running, you can access the Sensu web interface to manage your checks, configure notifications, and monitor your infrastructure.
Basic Tutorials of Sensu: Getting Started
Once Sensu is installed, you can begin monitoring your infrastructure by following these basic steps:
- Set Up the Dashboard: Access the web dashboard and log in with your credentials. You’ll find a user-friendly interface for configuring your monitoring environment.
- Add Hosts and Services: Add the systems you want to monitor by registering hosts and services in the Sensu dashboard.
- Create Checks: Define the checks for the services and resources you want to monitor. Sensu has built-in checks, but you can also create custom ones using scripts or plugins.
- Set Up Alerting: Configure how and when you want to be alerted when a problem is detected. You can send alerts via email, Slack, or other messaging platforms.
- Monitor Performance: Use Sensu’s dashboard to monitor the performance of your systems and check for any anomalies. Review performance metrics to optimize your infrastructure.
The Power of Sensu
Sensu is a robust, flexible, and scalable monitoring solution that helps businesses monitor their IT infrastructure, applications, and services. Whether you’re managing on-premise systems, cloud-native environments, or containerized applications, Sensu provides the real-time insights you need to maintain high availability and performance.
With its powerful features, ease of use, and wide range of use cases, Sensu is a valuable tool for businesses of all sizes looking to improve their monitoring practices.