In today’s dynamic IT landscape, businesses rely on robust monitoring tools to ensure the reliability and performance of their infrastructure. Zabbix is a powerful, enterprise-grade open-source monitoring platform that provides end-to-end monitoring of IT environments, applications, and networks. It empowers organizations to gain visibility into the health and performance of their systems, enabling them to identify and resolve issues proactively.
Zabbix stands out due to its scalability, flexibility, and comprehensive feature set. It can monitor everything from servers, cloud environments, and databases to IoT devices and business processes. With real-time alerting, customizable dashboards, and extensive integration options, Zabbix is trusted by organizations worldwide to optimize operations and prevent downtime.
What is Zabbix?
Zabbix is an all-in-one monitoring solution designed to track the availability, performance, and health of IT infrastructure. It collects and analyzes metrics from hardware, software, and services, providing actionable insights through graphs, reports, and notifications. Zabbix operates in real time, ensuring that businesses can detect and address problems before they escalate.
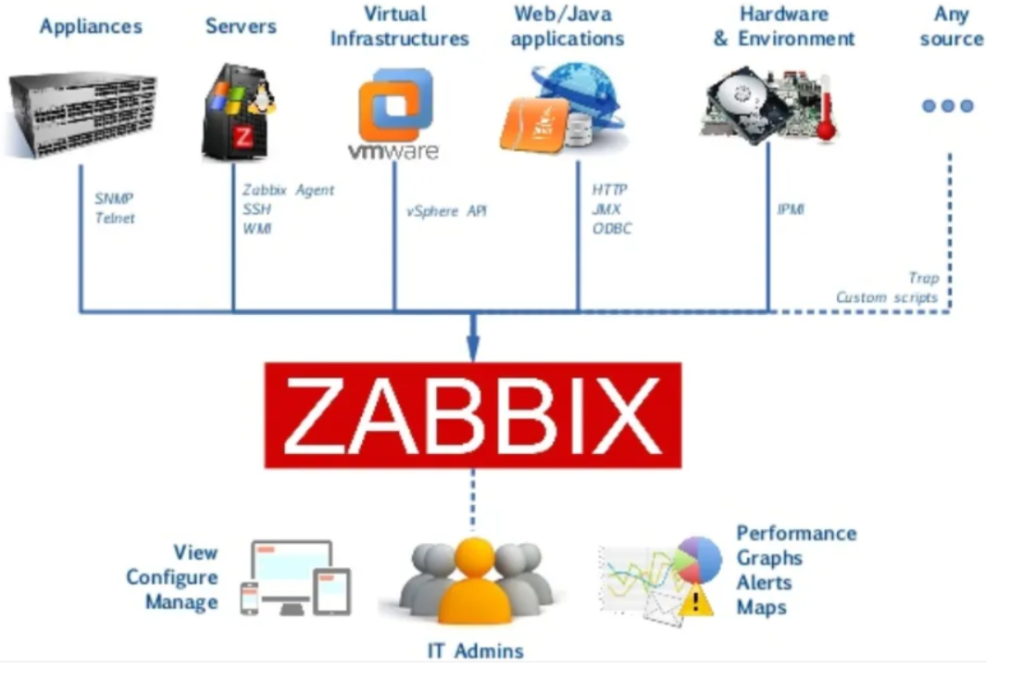
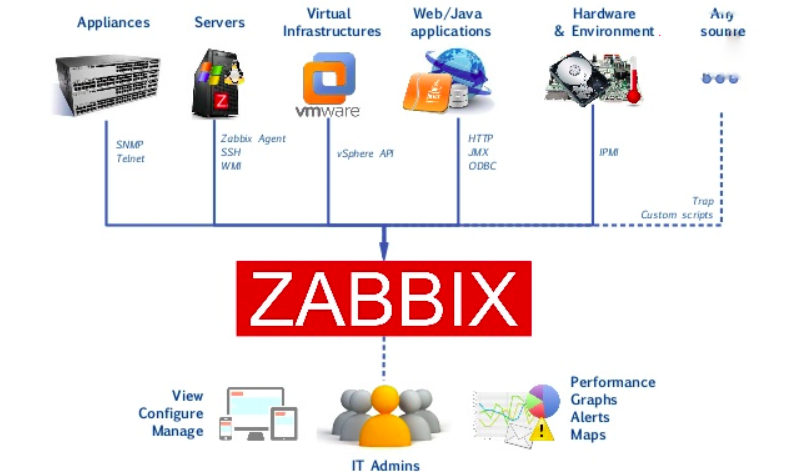
The platform supports both agent-based and agentless monitoring, allowing users to gather metrics from various sources using native Zabbix agents or standard protocols such as SNMP, IPMI, and JMX. With a highly customizable interface, Zabbix enables teams to create dashboards tailored to their specific needs. It is suitable for environments of all sizes, from small setups to large-scale enterprise deployments.
Top 10 Use Cases of Zabbix
- Server Monitoring
Monitor the performance of Linux, Windows, and Unix servers, including metrics such as CPU usage, disk I/O, and memory consumption. Detect anomalies and optimize resource utilization. - Network Device Monitoring
Track the health and performance of routers, switches, firewalls, and other network devices using SNMP. Identify bottlenecks and maintain network reliability. - Cloud Infrastructure Monitoring
Monitor virtual machines, storage, and resources on cloud platforms such as AWS, Microsoft Azure, and Google Cloud. Gain insights into cost efficiency and resource usage. - Application Performance Monitoring (APM)
Ensure application health by monitoring transaction times, error rates, and application dependencies. Detect slowdowns and ensure a smooth user experience. - Database Monitoring
Track query performance, connection pools, and resource utilization for databases like MySQL, PostgreSQL, MongoDB, and Oracle. Identify bottlenecks affecting performance. - IoT and Industrial Device Monitoring
Monitor IoT devices and industrial systems for uptime, connectivity, and operational health. This is particularly useful in industries like manufacturing and logistics. - Kubernetes and Container Monitoring
Monitor Docker containers, Kubernetes clusters, and microservices. Gain visibility into container resource usage and ensure the stability of containerized applications. - Business Process Monitoring
Monitor workflows and business-critical processes to ensure operational continuity. For example, track the status of automated financial transactions or e-commerce order processing. - Security Monitoring
Track firewall logs, intrusion detection systems, and access logs for potential security threats. Use Zabbix to maintain compliance with security standards. - Energy and Environmental Monitoring
Monitor the energy consumption of data centers, temperature levels in server rooms, and environmental metrics to optimize efficiency and prevent hardware damage.

What Are the Features of Zabbix?
- Real-Time Monitoring
Zabbix provides real-time monitoring of infrastructure, applications, and networks, enabling teams to detect and respond to issues as they arise. - Flexible Data Collection
Collect data using Zabbix agents, SNMP, IPMI, JMX, or custom scripts. This flexibility allows Zabbix to monitor virtually any metric from any device. - Customizable Dashboards
Create tailored dashboards to visualize key performance metrics, trends, and alerts. Dashboards can include maps, graphs, and widgets for intuitive monitoring. - Proactive Alerts and Notifications
Configure triggers to generate alerts for specific conditions, such as high CPU usage or failed services. Send notifications via email, SMS, Slack, or other channels. - Scalability for Large Environments
Scale your monitoring across thousands of devices and multiple locations using Zabbix proxies. Distributed monitoring ensures performance even in large setups. - Historical Data Retention
Store and analyze historical metrics to identify trends, forecast performance, and plan capacity upgrades. - Open-Source and Cost-Effective
Zabbix is completely free and open-source, making it accessible to organizations of all sizes without licensing costs. - Integration Ecosystem
Use Zabbix’s APIs to integrate with third-party tools like Grafana, Ansible, and ServiceNow. Leverage community plugins for added functionality. - Multi-Tenancy Support
Manage separate environments or customers using Zabbix’s multi-tenancy features, ideal for managed service providers (MSPs). - Enhanced Security Features
Implement role-based access control (RBAC), encrypted communications, and secure authentication to protect sensitive data.
How Zabbix Works and Architecture
How It Works:
Zabbix collects performance data from monitored devices and compares it against predefined thresholds. Alerts are triggered when these thresholds are breached, and data is stored for analysis and visualization.
Architecture Overview:
- Zabbix Server:
Acts as the core of the system, responsible for data collection, storage, and processing. - Database:
Stores configuration data, metrics, events, and historical data for analysis. - Zabbix Agents:
Installed on monitored devices to collect detailed metrics and send them to the Zabbix server. - Proxies:
Used to scale monitoring by offloading data collection and preprocessing in distributed environments. - Frontend (Web Interface):
Provides a user-friendly dashboard for configuring monitoring, visualizing data, and managing alerts. - Alerting System:
Configures triggers and actions to notify users of critical issues.
How to Install Zabbix
Steps to Install Zabbix on Linux:
1. Update the System:
sudo apt update && sudo apt upgrade2. Add Zabbix Repository: Download and add the Zabbix repository to your package manager:
wget https://repo.zabbix.com/zabbix/6.0/ubuntu/pool/main/z/zabbix-release/zabbix-release_6.0-1+ubuntu20.04_all.deb
sudo dpkg -i zabbix-release_6.0-1+ubuntu20.04_all.deb
sudo apt update
3. Install Zabbix Server, Frontend, and Agent:
sudo apt install zabbix-server-mysql zabbix-frontend-php zabbix-apache-conf zabbix-agent4. Configure Database:
- Create a Zabbix database:
CREATE DATABASE zabbix CHARACTER SET utf8mb4 COLLATE utf8mb4_bin;
CREATE USER 'zabbix'@'localhost' IDENTIFIED BY 'password';
GRANT ALL PRIVILEGES ON zabbix.* TO 'zabbix'@'localhost';
FLUSH PRIVILEGES;- Import the database schema:
zcat /usr/share/doc/zabbix-server-mysql*/create.sql.gz | mysql -u zabbix -p zabbix5. Start Zabbix Services:
sudo systemctl start zabbix-server zabbix-agent apache2
sudo systemctl enable zabbix-server zabbix-agent apache2
6. Access Zabbix Dashboard: Open your browser and navigate to http://<server_ip>/zabbix. Complete the installation wizard by connecting to the database and setting an admin password.
Basic Tutorials of Zabbix: Getting Started
- Adding a Host:
- Go to “Configuration” > “Hosts” and add a host.
- Enter the IP address and link monitoring templates for automated checks.
- Setting Up a Trigger:
- Define a trigger for a metric, such as CPU load > 80%, to generate alerts.
- Creating Dashboards:
- Design custom dashboards with widgets for graphs, maps, and alerts.
- Configuring Proxies:
- Use proxies to monitor devices in remote or distributed environments.
- Integrating with Grafana:
- Connect Zabbix to Grafana for enhanced visualization and reporting.